Download
1 / 30
300 likes | 372 Views
B iological P roduction R ates in the Southern California Current System. David Munro University of Washington. Acknowledgements. Paul Quay, Mark Haught , Johnny Stutsman, and Jackie Leung (UW) Laurie Juranek , Cynthia Peacock (NOAA ), Deirdre Lockwood, Hilary Palevsky

E N D
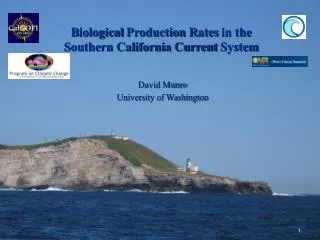
Biological Production Rates in the Southern California Current System David Munro University of Washington
Acknowledgements • Paul Quay, Mark Haught, Johnny Stutsman, and Jackie Leung (UW) • Laurie Juranek, Cynthia Peacock (NOAA), Deirdre Lockwood, Hilary Palevsky • Ralf Goericke, Dave Wolgast, and CalCOFI research associates (SIO)
Acknowledgements • Funding sources • First year graduate fellowship from the Program on Climate Change • Office of Naval Research (NDSEG) fellowship • NASA WA space grant fellowship • National Science Foundation support for sample supplies and analysis
Primary Production and Carbon Export in the Coastal Ocean • Global aquatic PP from satellites ~45-50 Pg C y-1 (Carr et al., 2006) • Based on derived Chl a, PAR, SST, and calibrated with 14C PP • Estimates vary by a factor of 2 (Campbell et al., 2002; Carr et al. 2006) • ~20% of ocean PP occurs in continental margins (50-2000 m depth) (Carr et al., 2002; Muller-Karger et al., 2005) • 40 to 50% of global C export flux occurs in continental margins (Muller-Kargeret al., 2005; Dunne et al. 2007) • Eastern Boundary Currents (EBC’s) <1% of ocean surface area but ~20% of global fish catch
Sea surface chlorophyll From Sarmiento and Gruber
Net Primary Production From Sarmiento and Gruber
Air-Sea C Flux in the Coastal Ocean • Globally, coastal seas may be a small net sink, high variability • -0.22±0.16 Pg C y-1 (Cai et al. 2006) • Global ocean ~ -2.0 Pg C y-1 • High variability, many poorly characterized systems • Table 1 and Fig. from Cai et al. 2006
Productivity terms • GOP – Gross O2 production; photosynthetic O2 production via water-splitting reactions in PSII • NCP – Net community production; net production of O2 or C in surface ocean after demands of autotrophic and heterotrophic communities have been met • NPP – Net primary production (Gross C production minus respiration by phytoplankton) • Estimated using 14C-PP and VGPM • NCP/GOP ratio – An estimate of the fraction of gross production available for export in terms of O2. • NCP/NPP – equivalent to e-ratio or ef-ratio; fraction of NPP in C terms available for export
Study Goals I: Spatial and seasonal variability of PP rates • Determine variability of PP and NCP and its impact on coastal C system using in situ methods • Gross oxygen production (GOP) • using 17Δ of dissolved O2 • Net community production (NCP) • NOP = GOP – (Community Resp) • using (O2/Ar)measured • Export efficiency (NOP/GOP) • Comparison to incubation-based 14C-PP • Validation of satellite-based PP in the coastal ocean
Study Goals II: Variability in C export over the last three decades • Estimate NCP using four different approaches • Mixed layer O2 budget • Mixed layer nitrate budget • 15N uptake f-ratios combined with 14C-PP • Satellite-based (VGPM) x export algorithms • Dunne et al. (2007); Laws et al. (2000) • O2-NCP from biological O2 saturation based on O2/Ar measurements • Evaluate interannual and decadal variability in NCP
Study Site: CalCOFI • CalCOFIgrid coded by region • 17DO2/Ar Samples collected during 6 cruises Annual Mean Surface Chl a in mg m-3 from Photobiology Group (SIO)
14C PP: why another method? • In vitro effects are a big unknown (Marra, 2002) • Uncertainty in what it actually measures (Marra, 2002) • Something between GCP and NCP, closest to net primary production (NPP) • Recycling of labeled C • Some labeled C is dissolved (depending on methodology either included/excluded) • Snapshot estimate (6 to 24 hours) • Logistical constraints
17Δ in situ GOP Method • Uses a mixed layer O2 and O2-isotope budget to estimate GOP in the mixed layer • Luz and Barkan (2000) • GOP = Kgas* [O2]sat* • 17Dnot sensitive to respiration • More terms in the coastal ocean (i.e. coastal upwelling, curl-driven upwelling, horizontal transports) • Must convert from O2 to C • Not based on an incubation • (17Δdiss – 16) (249 – 17Δdiss)
Ocean Range of 17Δ Values Purely Photosynthetic O2 249±15 per meg Half Photo + Half Gas Exchange O2 132 per meg 16±2 per meg Purely Gas Exchange O2 Measuring 17Δ yields a direct estimate of the proportion of O2 from air and photosynthesis.
Locations of 17D measurements to date, from Juranek and Quay (2013)
O2/Ar in situ NCP method • NCP estimates (in O2 terms) are based on mixed layer budgets for [O2] and [Ar] • NCP = Kgas* [O2]sat * ( – 1) • NCP/GOP a measure of export efficiency from one measurement • Does NOT depend on gas exchange (Kgas) • NCP/GOP is comparable to f-ratio • 2x N/G ~ f-ratio (new production/net primary production) • (O2/Ar)meas (O2/Ar)sat
Spatial maps of 17Ddissand biological O2saturation (from O2/Ar) August August • Samples collected at up to 50 of 66 standard CalCOFI stations compared to 16 productivity (14C-PP) stations
Variability of 17D-GOP and O2:Ar-NCP Annual NCP and GOP in mmol O2 m-2 d-1
17D-GOP : 14C-PP MBARI (Munro and Quay, unpublished data) From Juranek and Quay (2013)
Comparison of NCP/GOP • Coastal Ocean NCP/GOP ratio similar to open ocean (unexpected)
Particle Export Ratio As predicted by the Dunne et al. 2007 algorithm which is a function of chl a and SST From Sarmiento and Gruber
POC Export Production From Sarmiento and Gruber
Conclusions I • 17D-GOP shows seasonality nearshore • 17D-GOP consistently 5-7x 14C-PP and 4x VGPM • 17D-GOP/14C-PP = 2-3x at MBARI • Suggests that CalCOFI14C-PP underestimates NPP due to methodological effects in 14C-PP • Cannot rule out variability in O2/C • NCP:GOP ratios close to ratios observed in the open ocean (0.1 to 0.2) • Higher ratios than predicted by export models offshore
Trends in O2 in the S. Cal. Current O2 trends at ~250 m depth From McClatchie et al. 2010 Bograd et al. 2008 %change in O2 1984-2006
Methods: Estimating Biological O2 saturation using O2 saturation Consistent relationship between biological O2 saturation and O2 saturation Estimated for each region/season O2 and nitrate budgets constructed: upwelling terms; horizontal advection; time rate of change; NCP
NCP anomaly calculated by differencing quarterly NCP with long-term mean for month of cruise
Longterm NCP trends in the South CCS MEI: Multivariate ENSO Index (Wolter and Timlin 1998) PDO: Pacific Decadal Oscillation (Mantua et al. 1997) NPGO: North Pacific Gyre Oscillation (Di Lorenzo et al. 2008)
Conclusions II • Negative NCP anomalies in response to strong El Niño events (e.g., 1987, 1991-92, 1998) • Less signficantNCP response to weak El Niño and La Niña events. • Since 2007, positive NCP anomalies based on all NCP estimates (i.e., O2:Ar, nitrate budget, 15N incubations and satellite NPP) • NCP trends over the past three decades suggest that export of organic material to depth within the CalCOFI grid not responsible for lower O2 concentrations at depth observed by Bograd et al. (2008) and McClatchie et al. (2010)