Download
1 / 1
10 likes | 195 Views
SAPRiSE Project. Contrasting different techniques for identifying the role of Sun and the El Niño Southern Oscillation on Indian Summer Monsoon Rainfall. Indrani Roy and Mat Collins

E N D
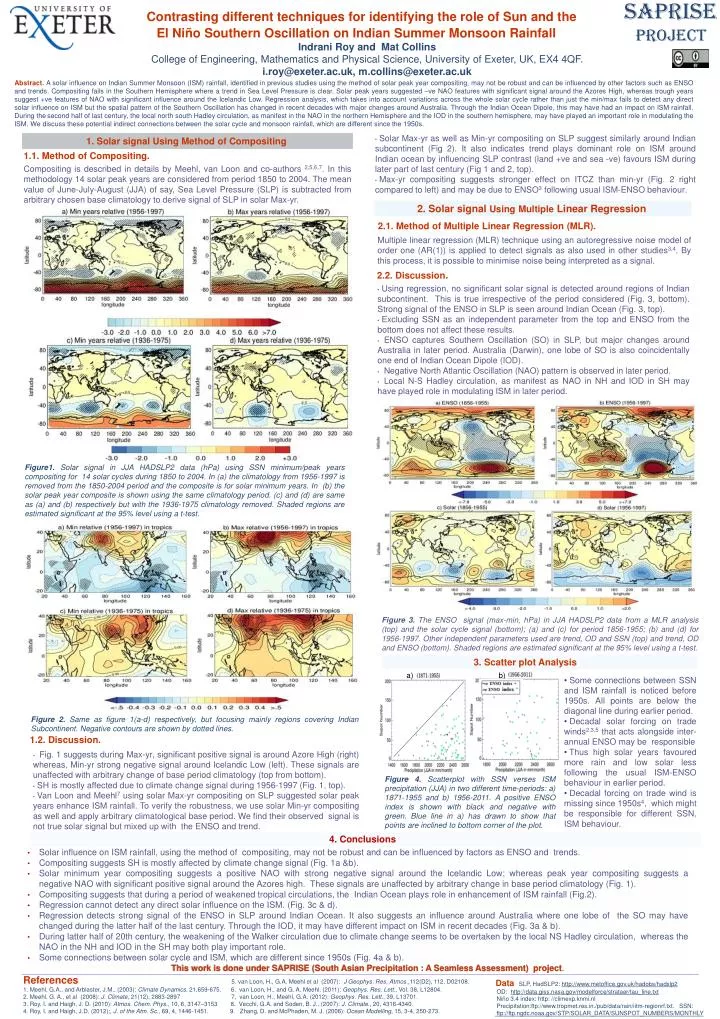
SAPRiSE Project Contrasting different techniques for identifying the role of Sun and the El Niño Southern Oscillation on Indian Summer Monsoon Rainfall Indrani Roy and Mat Collins College of Engineering, Mathematics and Physical Science, University of Exeter, UK, EX4 4QF. i.roy@exeter.ac.uk, m.collins@exeter.ac.uk Abstract.A solar influence on Indian Summer Monsoon (ISM) rainfall, identified in previous studies using the method of solar peak year compositing, may not be robust and can be influenced by other factors such as ENSO and trends. Compositing fails in the Southern Hemisphere where a trend in Sea Level Pressure is clear. Solar peak years suggested –ve NAO features with significant signal around the Azores High, whereas trough years suggest +ve features of NAO with significant influence around the Icelandic Low. Regression analysis, which takes into account variations across the whole solar cycle rather than just the min/max fails to detect any direct solar influence on ISM but the spatial pattern of the Southern Oscillation has changed in recent decades with major changes around Australia. Through the Indian Ocean Dipole, this may have had an impact on ISM rainfall. During thesecond half of last century, the local north south Hadley circulation, as manifest in the NAO in the northern Hemisphere and the IOD in the southern hemisphere, may have played an important role in modulating the ISM. We discuss these potential indirect connections between the solar cycle and monsoon rainfall, which are different since the 1950s. • Solar Max-yr as well as Min-yr compositing on SLP suggest similarly around Indian subcontinent (Fig 2). It also indicates trend plays dominant role on ISM around Indian ocean by influencing SLP contrast (land +veand sea -ve) favours ISM during later part of last century (Fig 1 and 2, top). • Max-yr compositing suggests stronger effect on ITCZ than min-yr(Fig. 2 right compared to left) and may be due to ENSO3 following usual ISM-ENSO behaviour. • 1. Solar signal Using Method of Compositing • 1.1. Method of Compositing. Compositing is described in details by Meehl, van Loon and co-authors 2,5,6,7. In this methodology 14 solar peak years are considered from period 1850 to 2004. The mean value of June-July-August (JJA) of say, Sea Level Pressure (SLP) is subtracted from arbitrary chosen base climatology to derive signal of SLP in solar Max-yr. • 2. Solar signal UsingMultiple Linear Regression • 2.1. Method of Multiple Linear Regression (MLR). Multiple linear regression (MLR) technique using an autoregressive noise model of order one (AR(1)) is applied to detect signals as also used in other studies3,4. By this process, it is possible to minimise noise being interpreted as a signal. • 2.2. Discussion. • Using regression, no significant solar signal is detected around regions of Indian subcontinent. This is true irrespective of the period considered (Fig. 3, bottom). Strong signal of the ENSO in SLP is seen around Indian Ocean (Fig. 3, top). • Excluding SSN as an independent parameter from the top and ENSO from the bottom does not affect these results. • ENSO captures Southern Oscillation (SO) in SLP, but major changes around Australia in later period. Australia (Darwin), one lobe of SO is also coincidentally one end of Indian Ocean Dipole (IOD). • Negative North Atlantic Oscillation (NAO) pattern is observed in later period. • Local N-S Hadley circulation, as manifest as NAO in NH and IOD in SH may have played role in modulating ISM in later period. Figure1. Solar signal in JJA HADSLP2 data (hPa) using SSN minimum/peak years compositing for 14 solar cycles during 1850 to 2004. In (a) the climatology from 1956-1997 is removed from the 1850-2004 period and the composite is for solar minimum years. In (b) the solar peak year composite is shown using the same climatology period. (c) and (d) are same as (a) and (b) respectively but with the 1936-1975 climatology removed. Shaded regions are estimated significant at the 95% level using a t-test. Figure 3.The ENSO signal (max-min, hPa) in JJA HADSLP2 data from a MLR analysis (top) and the solar cycle signal (bottom); (a) and (c) for period 1856-1955; (b) and (d) for 1956-1997. Other independent parameters used are trend, OD and SSN (top) and trend, OD and ENSO (bottom). Shaded regions are estimated significant at the 95% level using a t-test. • 3. Scatter plot Analysis a) b) • Some connectionsbetween SSN and ISM rainfall is noticed before 1950s. All points are below the diagonal line during earlier period. • Decadal solar forcing on trade winds2,3,5that acts alongside inter-annual ENSO may be responsible • Thus high solar years favoured more rain and low solar less following the usual ISM-ENSO behaviour in earlier period. • Decadal forcing on trade wind is missing since 1950s4, which might be responsible for different SSN, ISM behaviour. Figure 2.Same as figure 1(a-d) respectively, but focusing mainly regions covering Indian Subcontinent. Negative contours are shown by dotted lines. • 1.2. Discussion. • Fig. 1 suggests during Max-yr, significant positive signal is around Azore High (right) whereas, Min-yrstrong negative signal around Icelandic Low (left). These signals are unaffected with arbitrary change of base period climatology (top from bottom). • SH is mostly affected due to climate change signal during 1956-1997 (Fig. 1, top). • Van Loon and Meehl7using solar Max-yr compositing on SLP suggested solar peak years enhance ISM rainfall. To verify the robustness, we use solar Min-yr compositing as well and apply arbitrary climatological base period. We find their observed signal is not true solar signal but mixed up with the ENSO and trend. Figure 4.Scatterplot with SSN verses ISM precipitation (JJA) in two different time-periods: a) 1871-1955 and b) 1956-2011. A positive ENSO index is shown with black and negative with green. Blue line in a) has drawn to show that points are inclined to bottom corner of the plot. 4. Conclusions • Solar influence on ISM rainfall, using the method of compositing, may not be robust and can be influenced by factors as ENSO and trends. • Compositing suggests SH is mostly affected by climate change signal (Fig. 1a &b). • Solar minimum year compositing suggests a positive NAO with strong negative signal around the Icelandic Low; whereas peak year compositing suggests a negative NAO with significant positive signal around the Azores high. These signals are unaffected by arbitrary change in base period climatology (Fig. 1). • Compositing suggests that during a period of weakened tropical circulations, the Indian Ocean plays role in enhancement of ISM rainfall (Fig.2). • Regression cannot detect any direct solar influence on the ISM. (Fig. 3c & d). • Regression detects strong signal of the ENSO in SLP around Indian Ocean. It also suggests an influence around Australia where one lobe of the SO may have changed during the latter half of the last century. Through the IOD, it may have different impact on ISM in recent decades (Fig. 3a & b). • During latter half of 20th century, the weakening of the Walker circulation due to climate change seems to be overtaken by the local NS Hadley circulation, whereas the NAO in the NH and IOD in the SH may both play important role. • Some connections between solar cycle and ISM, which are different since 1950s (Fig. 4a & b). This work is done under SAPRISE (South Asian Precipitation : A Seamless Assessment) project. References 5. van Loon, H., G.A. Meehl et al (2007): J Geophys. Res.Atmos.,112(D2), 112, D02108. 1. Meehl, G.A., and Arblaster, J.M., (2003): Climate Dynamics, 21,659-675. 6. van Loon, H., and G. A. Meehl, (2011): Geophys. Res. Lett., Vol. 38, L12804. 2. Meehl, G. A., et al (2008): J. Climate, 21(12), 2883-2897 7, van Loon, H., Meehl, G.A. (2012): Geophys. Res. Lett., 39, L13701. 3. Roy, I. and Haigh, J. D. (2010): Atmos. Chem. Phys., 10, 6, 3147–3153 8. Vecchi, G.A. and Soden, B. J., (2007): J. Climate., 20, 4316-4340. 4. Roy, I. and Haigh, J.D. (2012):, J. of the Atm. Sc., 69, 4, 1446-1451. 9. Zhang, D. and McPhaden, M. J. (2006): Ocean Modelling, 15, 3-4, 250-273. DataSLP, HadSLP2: http://www.metoffice.gov.uk/hadobs/hadslp2 OD: http://data.giss.nasa.gov/modelforce/strataer/tau_line.txt Niño 3.4 index: http: //climexp.knmi.nl Precipitation:ftp://www.tropmet.res.in./pub/data/rain/iitm-regionrf.txt. SSN: ftp://ftp.ngdc.noaa.gov/STP/SOLAR_DATA/SUNSPOT_NUMBERS/MONTHLY