Download
1 / 40
410 likes | 523 Views
Enhancing Policy Decision Making with Large-Scale Digital Traces. Vanessa Frias-Martinez University of Maryland NFAIS, February 2014. 5.9 billion 87%. 3.2 billion unique users 45%. mobile devices >>humans . Have you ever heard of DATIFICATION? 1. Yes

E N D
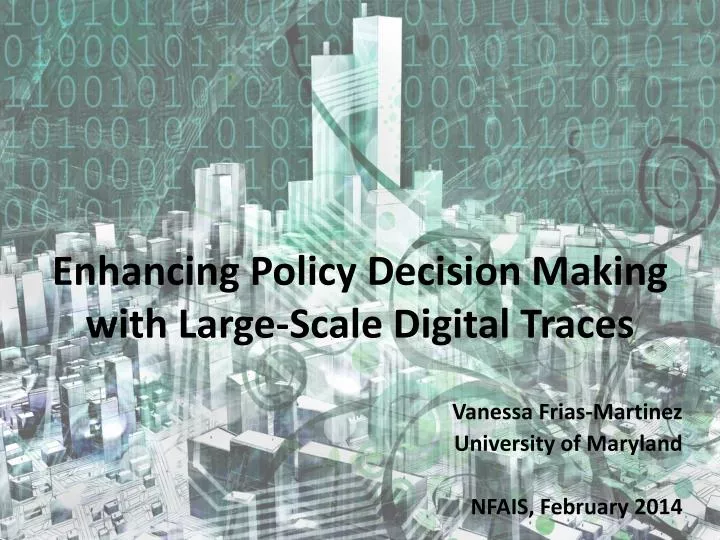
EnhancingPolicyDecisionMakingwithLarge-Scale Digital Traces Vanessa Frias-Martinez University of Maryland NFAIS, February 2014
5.9 billion 87% 3.2 billion unique users 45% mobile devices >>humans
Have you ever heard of DATIFICATION? 1. Yes 2. No
Mobile Digital Footprints… …for Social Good?
ResearchGoal To extract human behavioral information from mobile digital traces in order to assist decision makers in organizations working for social development
TOOLS Energy BEHAVIORAL INSIGHTS Education To enhance or complement information in an affordable manner Interviews, surveys: Information to assist on policy decisions Health Data Mining Machine Learning Statistical Transportation MOBILE DIGITAL TRACES Safety RESEARCH DECISION MAKERS
Outline • Cell Phone Data • Projects with Social Impact • Cencell • AlertImpact
CallDetail Records Granularity 1-4km² Anonymized CDR: Caller | Callee | Date | Duration | Geolocation
ModelingHumanBehavior Over 270 variables
CenCell Cost-EffectiveCensusMaps FromCellPhone Data
Motivation: CensusMaps A/B C+ C D E
NationalStatisticalInstitutes A/B C+ C D E
Important Data Comes at a Price Expensive Lowresourceregions A/B C+ C D E
Can the variables extracted from Call Detail Records be used as predictors of regional socioeconomic levels (SELs)?
Cost-effectiveMaps NSI surveyssubset of regions NSI carriesoutsurveys CellPhone Data ForecastingModels REDUCE COSTS PredictthePresent
Classifying SELs - Training • SEL CLASSIFIER Aggregated 1-4km²
ClassifyingSELs - Testing CLASSIFIER SEL Aggregated
Datasets • Data for a city in Latin America (NSI) • 1200 regions (GUs) • SEL values from 0..100 • Call Detail Records • 6 months, 500K customers • City has 920 coverage areas • 279 variables per coverage area
EvaluationResults RandomForests 86% 3 SELs (A,B,C) EM Clustering 68% 6 SELs (A,B,…,F)
Insights Consumption Variables Mobility Variables
AlertImpact UnderstandingtheImpact of HealthAlertsusingCellPhone Data
Can wemeasuretheimpactthatgovernmentalertshadonthemobility of thepopulation ?
Evaluation • Call Records from 1stJantill 31stMay 2009 • Compute mobility as differentnumber of BTSsvisited • Stages • MedicalAlert - Stage 1 (17th-27thApril) • ClosingSchools - Stage 2 (28th-1stMay) • Suspension of EssentialActivities - Stage 3 (1st May-6thMay) • Baselines • sameperiods, differentyear (2008)
Changes in Mobility May 6th April 27th May 1st Mobilityreducedbetween 10% and 30% Reopen Alert Closed Shutdown Alert Suspension Reopen Closed Baseline
Changes in EpidemicSpreading Baseline (“preflu” behaviorallweeks) Intervention (alert,closed,shutdown) BASELINE K Epidemicpeakpostponed 40 hours Reducednumber of infected in peakagentsby 10%
University Campus StatisticallySignificantDecreaseduringStages 2 and 3
Airport StatisticallySignificantIncreaseduringStages 2 and 3
TakeAwayMessage • Geolocated traces allowustoquantitatively • Modelhumanbehavior • Measurebehavioralchanges • Predict/Classifyexternalsources of information
Future • Enhance and complementthetoolscurrentlyusedbydecisionmakersin organizationsworkingforsocial good • Use of open datasets, social media and other digital traces
Thanks !! vfrias@umd.edu