Download
1 / 1
10 likes | 124 Views
The key steps of the project. Select indicators (not land cover) that can be used in the short term (even when imperfect) Identify indicators by pressure, spatial configuration, semantic composition, and temporal distribution.

E N D
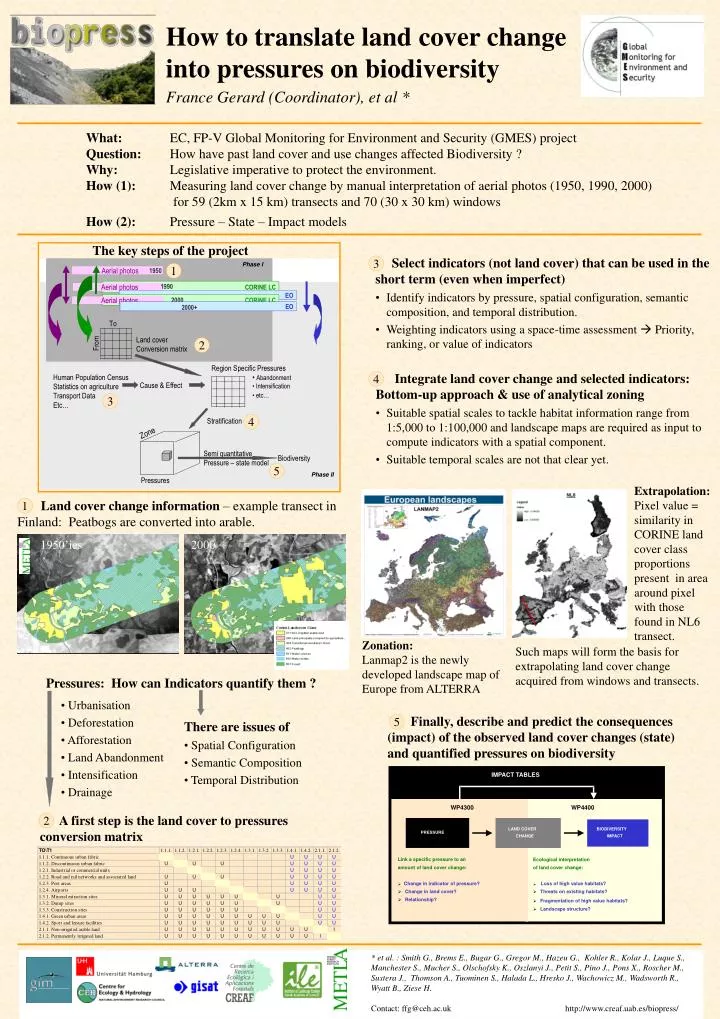
The key steps of the project • Select indicators (not land cover) that can be used in the short term (even when imperfect) • Identify indicators by pressure, spatial configuration, semantic composition, and temporal distribution. • Weighting indicators using a space-time assessment Priority, ranking, or value of indicators 3 1 2 • Integrate land cover change and selected indicators: Bottom-up approach & use of analytical zoning • Suitable spatial scales to tackle habitat information range from 1:5,000 to 1:100,000 and landscape maps are required as input to compute indicators with a spatial component. • Suitable temporal scales are not that clear yet. 4 3 4 • Urbanisation • Deforestation • Afforestation • Land Abandonment • Intensification • Drainage 5 • There are issues of • Spatial Configuration • Semantic Composition • Temporal Distribution Land cover change information – example transect in Finland: Peatbogs are converted into arable. 1 1950’ies 2000 Such maps will form the basis for extrapolating land cover change acquired from windows and transects. Pressures: How can Indicators quantify them ? Extrapolation: Pixel value = similarity in CORINE land cover class proportions present in area around pixel with those found in NL6 transect. Finally, describe and predict the consequences (impact) of the observed land cover changes (state) and quantified pressures on biodiversity 5 IMPACT TABLES A first step is the land cover to pressures conversion matrix 2 WP4300 WP4400 LAND COVER BIODIVERSITY PRESSURE CHANGE IMPACT Link a specific pressure to an Ecological interpretation amount of land cover change: of land cover change: Zonation: Lanmap2 is the newly developed landscape map of Europe from ALTERRA Change in indicator of pressure? Loss of high value habitats? Ø Ø Change in land cover? Threats on existing habitats? Ø Ø Relationship? Ø Fragmentation of high value habitats? Ø Landscape structure? Ø How to translate land cover change into pressures on biodiversity France Gerard (Coordinator), et al * What: EC, FP-V Global Monitoring for Environment and Security (GMES) project Question: How have past land cover and use changes affected Biodiversity ? Why: Legislative imperative to protect the environment. How (1): Measuring land cover change by manual interpretation of aerial photos (1950, 1990, 2000) for 59 (2km x 15 km) transects and 70 (30 x 30 km) windows How (2): Pressure – State – Impact models * et al. : Smith G., Brems E., Bugar G., Gregor M., Hazeu G., Kohler R., Kolar J., Luque S., Manchester S., Mucher S., Olschofsky K., Oszlanyi J., Petit S., Pino J., Pons X., Roscher M., Sustera J., Thomson A., Tuominen S., Halada L., Hresko J., Wachowicz M.,Wadsworth R., Wyatt B., Ziese H. Contact: ffg@ceh.ac.uk http://www.creaf.uab.es/biopress/