Download
1 / 29
290 likes | 361 Views
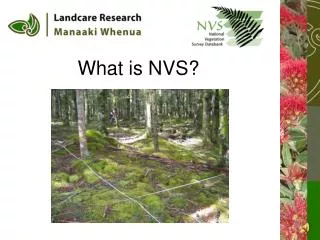
Tour of the NANOOS Visualization System (NVS). Sarah Mikulak NANOOS Education Specialist smikulak@uw.edu. Welcome to NVS!. Located at http:// nvs.nanoos.org NVS is NANOOS’s Google Maps-based portal to data and forecasts.

E N D
Tour of the NANOOS Visualization System (NVS) Sarah Mikulak NANOOS Education Specialist smikulak@uw.edu
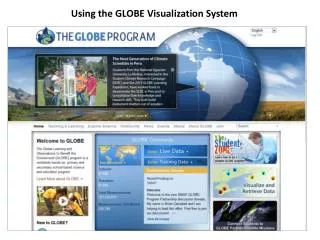
Welcome to NVS! • Located at http://nvs.nanoos.org • NVS is NANOOS’s Google Maps-based portal to data and forecasts. • This tour will give you a quick run-down of what NVS has to offer.
NVS Entrance Page Click on to see main data portal
Main NVS Page Click on any icons in the map or buttons in menu on left
Data from an icon Click on any icons in the map to get graphs of the past 24 hours, 7 days, or 30 days of data. You can download the data using the arrow icons below the time-range button.
Forecasts from an icon Click on Forecasts tab to see any forecasts from that location.
Comparator from an icon Click on Comparator tab to see the comparison of observed data verses models/forecasts.
Filters button Click on Filters to find assets (buoys, sensors, etc) that fit a certain criteria
Assets button Click on Assets to select only one type of asset, or to find a specific asset in the list
Overlays button Click on Overlays to find data and forecasts that overlay on top of the map
Regions button Click on Regions to select a region to zoom in on
Settings button Click on Settings to customize features and displays
Data and forecasts near Lincoln Co. OSU Gliders
Data and forecasts near Lincoln Co. NOAA Buoy
Data and forecasts near Lincoln Co. OSU Buoy
Data and forecasts near Lincoln Co. NOAA Weather Station
Data and forecasts near Lincoln Co. NOAA Tide Station
Data and forecasts near Lincoln Co. River gauge for Siletz and Alsea Rivers
Data and forecasts near Lincoln Co. Overlay: Sea Surface Current Data
Data and forecasts near Lincoln Co. Overlay: Sea Surface Temperature Data
Data and forecasts near Lincoln Co. Overlay: Chlorophyll-a Data
Data and forecasts near Lincoln Co. Overlay: Columbia River Salinity and Temperature Forecast
Data and forecasts near Lincoln Co. Overlay: Air Temperature Forecast
Data and forecasts near Lincoln Co. Overlay: Wind and Wave Forecast
Data and forecasts near Lincoln Co. Overlay: Sea Surface Temperature and Current Forecast
Data and forecasts near Lincoln Co. Overlay: Wave Forecast
Potential Activity: Observation Journaling • Have students observe ocean directly or via webcams (http://www.northwestwebcams.com/oregon-web-cams.shtm) • Have students compare observations to data and/or forecasts from NVS
Potential Activity: Monitoring a storm • If a storm is forecasted, look at: • Wind and wave forecast overlays • Barometer data and forecasts • Wind and wave data during the event • Precipitation data • Salinity data in bays • Turbidity data • River and tide gauge data
Potential Activity: Monitoring upwelling • See NANOOS’s “Well, Well, Well” lesson plan: • http://nanoos.org/education/lesson_plans/pdfs/well_well_well.pdf