Download
1 / 56
560 likes | 714 Views
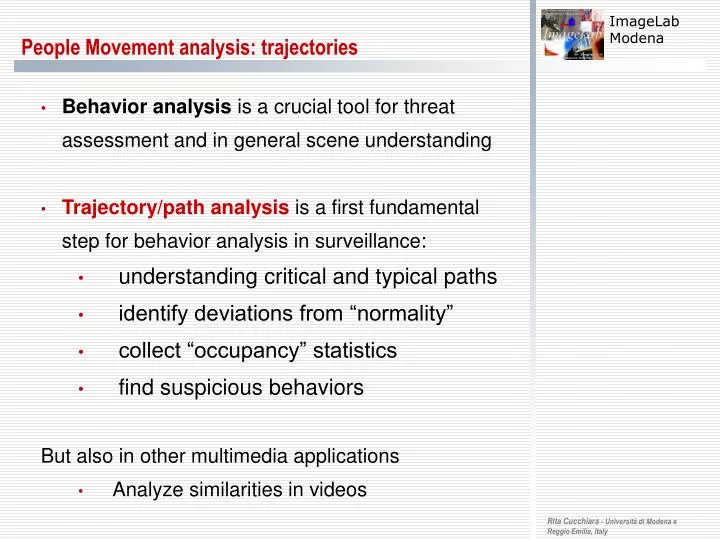
People Movement analysis: trajectories. Behavior analysis is a crucial tool for threat assessment and in general scene understanding Trajectory/path analysis is a first fundamental step for behavior analysis in surveillance: understanding critical and typical paths

E N D
People Movement analysis: trajectories • Behavior analysis is a crucial tool for threat assessment and in general scene understanding • Trajectory/path analysisis a first fundamental step for behavior analysis in surveillance: • understanding critical and typical paths • identify deviations from “normality” • collect “occupancy” statistics • find suspicious behaviors • But also in other multimedia applications • Analyze similarities in videos
Problem description • Given all the trajectories acquired by a video surveillance system: Which are the trajectories that share some specific location properties? Which are the trajectories that share some specific shape properties? Which are the most frequent Behaviors? Who did perform them? people retrieval
Literature on Trajectory analysis • Literature approaches on trajectory comparison can be classified: • Depending on the Feature (Point to Point vs Statistical): Adopt a point-to-point comparison or exploit statistical data representation • Depending on the Representation (Original vs Transformed): Original feature space or provide a space transformation • Depending on the Data Dimension (Complete vs Selected): Use all the temporal data or select a subset
References: (Basharat08) Basharat, A. Gritai, and M. Shah. Learning object motion patterns for anomaly detection and improved object detection. In Proc. of IEEE Int’l Conference on Computer Vision and Pattern Recognition, 2008 (Porikli04) F. Porikli and T. Haga. Event detection by eigenvector decomposition using object and frame features. In Proc. Of Computer Vision and Pattern Recognition (CVPR) Workshop,volume 7, pages 114–121, 2004. (Hu06)W. Hu, X. Xiao, Z. Fu, D. Xie, T. Tan, and S. Maybank. A system for learning statistical motion patterns. IEEE Trans. on PAMI, 28(9):1450–1464, September 2006. (Junejo04) Junejo, O. Javed, and M. Shah, “Multi feature path modeling for video surveillance,” in Proc. of Int’l Conference on Pattern Recognition, vol. 2, Aug. 2004, pp. 716– 719. (Bashir03) F. I. Bashir, A. A. Khokhar, and D. Schonfeld, “Segmented trajectory based indexing and retrieval of video data,” in Proc. of IEEE Int’l Conference on Image Processing, 2003, pp. 623–626. (Chen08) X. Chen, D. Schonfeld, and A. Khokhar, “Robust null space representation and sampling for view invariant motion trajectory analysis,” in Proc. of IEEE Int’l Conference on Computer Vision and Pattern Recognition, 2008. (Ding08) H. Ding, G. Trajcevski, P. Scheuermann, X. Wang, and E. J. Keogh, “Querying and mining of time series data: experimental comparison of representations and distance measures,” Proceedings of the VLDB Endowment, vol. 1, no. 2, pp. 1542–1552, 2008. (Shieh08) Jin Shieh and Eamonn Keogh (2008). iSAX: Indexing and Mining Terabyte Sized Time Series. SIGKDD 2008. • (Piotto09) N. Piotto, N. Conci, and F. De Natale. Syntactic matchingof trajectories for ambient intelligence applications.IEEE Transactions on Multimedia, 11(7):1266–1275,Nov. 2009. (Calderara09)S. Calderara, A. Prati, and R. Cucchiara. Learning people trajectories using semi-directional statistics. In Proceedings of IEEE International Conference on Advanced Video and Signal Based Surveillance (IEEE AVSS 2009), Genova, Italy, Sept. 2009. (Picciarelli08)Piciarelli, C.; Micheloni, C.; Foresti, G.L., "Trajectory-Based Anomalous Event Detection," Circuits and Systems for Video Technology, IEEE Transactions on , vol.18, no.11, pp.1544-1554, Nov. 2008
Available datasets of trajectories Various time series (including trajectories): • http://www.cis.temple.edu/~latecki/TestData/TS_Koegh/ • http://www.cs.ucr.edu/~eamonn/time_series_data/ • Character Trajectories Data Set: • http://archive.ics.uci.edu/ml/datasets/Character+Trajectories • Pen-Based Recognition of Handwritten Digits Data Set: • http://archive.ics.uci.edu/ml/datasets/Pen-Based+Recognition+of+Handwritten+Digits • ETISEO project: • http://www-sop.inria.fr/orion/ETISEO/download.htm#video_data • Soccer player trajectories: • “T. D’Orazio, M.Leo, N. Mosca, P.Spagnolo, P.L.MazzeoA Semi-Automatic System for Ground Truth Generation of Soccer Video SequencesIn the Proceedingof the 6th IEEE International Conference on Advanced Video and SignalSurveillance, Genoa, Italy September 2-4 2009” • Our own dataset: • More than 1000 trajectories of a video surveillance scenario (available at request)
Trajectory analysis from two different perspectives • Trajectories are time series of data • Querying datasets of time series is a well studied data mining problem which requires: • A similarity measure between two time series • A clustering technique to classify trajectories • In the database-related research the datasets are very large (VLDB) and typically comprise reproducible phenomena (several repetitions of the same class). Thus, similarity measure can be approximated but need to be fast. Clustering can rely on very high number of samples of the same class (simple 1NN clustering often suffices) • Viceversa, in video-surveillance research data availability is limited, very diverse from time to time and full of noise. This lack of reproducibility requires a precise measure, also at the cost of computational time. The few data available per class also require more sophisticated clustering approaches • Video surveillance scenarios also exhibit a high dinamicitywhich calls for adaptive methods for classification
Ding-Keogh 08 proposal • The method proposed in (Ding-Keogh 08) perform the comparison among time series in the original x-y data space. • The comparison is performed directly on the original points sequences using dynamic programming and the Dynamic Time Warping • Inexact matching such as DTW are required to account for different lengths in time series and for temporal shifts
(Ding08) Point-to-point Complete Original • DTW algorithm
(Ding08) Point-to-point Complete Original • Each point is compared using the Euclidean distance. • Each dimension, namely x and y sequences are compared separately • The final distance is the weighted average of the contributions of single dimensions. • The Method is effective when comparing similar sequences hence suitable when a large dataset is available, thus suitable for querying VLDB
Gullo09 • Francesco Gullo, Giovanni Ponti, Andrea Tagarelli, Sergio Greco, A timeseriesrepresentationmodelfor accurate and fast similarity detection, Pages 2998-3014, Pattern Recognition, vol. 42, 11, Nov. 2009 • Proposing a newrepresentationoftimeseriesbased on DSA (Derivative timeseriesSegmentApproximation) asdimensionalityreductionmethod and DTW assimilaritymeasure • Clusteringbased on UPGMA (UnweightedPair Group MethodusingarithmeticAverages) and classification on KNN • Comparisonwithseveralsimilaritymeasures (DTW, DDTW, LCSS, EDR, etc.) and withseveraldimensionalityreductionmethods (SAX, DWT, FWT, etc.). Comparison on 7 public datasetsusingF-measure
Gaussian Model for spatial analysis Sequenceof 2D spatialcoordinates • Advantagesofusingspatialcoordinates: • Embodiesadditional information aboutvelocity and acceleration • Some paths are more common thenotherdepending on their position on the scene • Representpartially the reactionof people to the structureof the scenario
Gaussian Model for spatial analysis • Due to the uncertainties on the measure of points coordinates we choose a Gaussian model to model every point location Bivariate GaussianCentered on point coordinate having fixed variance.
MappingGaussians to Symbols • A single trajectory is modeled as a sequence of point Coordinates: • On each point a Spatial Gaussian pdf is fitted. • Trajectory model is then represented as a sequence of symbols . Where
Clustering Trajectories Positional Gaussian Clustering • Frequent and anomalous behaviors can be obtained by clustering trajectories: • According to positions and detect the • most frequent activity zones • (Gaussian model)
On-line Trajectories Classification • Additionally trajectories can be classified on-line and anomalous paths detected. Normal Clusters Abnormal
Morris-Trivedi survey on trajectory analysis • B. Morris and M. Trivedi, “A survey of vision-based trajectory learning and analysis for surveillance,” IEEE Transactions on Circuits and Systems for Video Technology, vol. 18, no. 8, pp. 1114–1127, Aug. 2008.
Morris-Trivedi survey on trajectory analysis • B. Morris and M. Trivedi, “A survey of vision-based trajectory learning and analysis for surveillance,” IEEE Transactions on Circuits and Systems for Video Technology, vol. 18, no. 8, pp. 1114–1127, Aug. 2008.
Trajectoryshapeanalysis • Trajectoryshapeanalysisfor “abnormalbehavior” recognition in video surveillance.Differentcontextthan VLDB: few and noisy data, high degreeofvariability, trackingerrors • TrajectoryShapesimilarity; invarianttospaceshifts • Notonlyspace-based or time-basedsimilarity
TrajectoryShapeAnalysisbyangles Sequenceof 2D spatialcoordinates Sequenceof 1D angles • Advantagesofusingangles: • more compact representation • invarianttospatialtranslations (bothlocal and global), thusdescribingtrajectoryshape
ImagelabProposal • Trajectorydescriptionwith angle sequence • Statistical representationwith a Mixtureof Von MisesDistributions (MovM) • Coding with a sequenceofselectedvM pdf identifiers • Code Alignment • Clustering with k-medoids Definitionof EM algorithm for MovM UsingDynamicprogramming DefinitionofBhattacharyyadistance fon vM and on-line EM A. Prati, S. Calderara, R. Cucchiara, "UsingCircularStatisticsforTrajectoryAnalysis" in ProceedingsofCVPR 2008
Training set and on-line classification MovM(Tj) <S={S1j..Snjj},MovM(Tj)> EM for MoVM Coding with MAP Alignement Clustering with Br distance Trajectoryrepository Trajectory clustersrepository Normal/ abnormal Surveillance system Classificationwith Br distance On-line EM for MoVM Coding with MAP Alignement
Von Misesdistribution • When the variables represent angles, Gaussians or MoGsare inappropriate. • Example: two observations at 1° and 359°. Modeling these data with a univariateGaussian distribution is incorrect. In fact, if we select the origin at 0° • if we select the origin at 180° • Von Mises distribution is more suitable to treat periodic variables, being circularly defined • I0 = modified zero-order Bessel function of the first kind
Mixtureof von Mises and MixtureofGaussians (MoG) • MovM: MoG:
Modelling a single trajectory • 1)A single trajectory is modeled as a sequence of angles: • 2) A specifically defined EMalgorithm is used:
EM forMovMdistribution • MovM: • Likelihood of complete data set: • Expected value of the log likelihood: • E-step: estimate of the responsabilities:
EM forMovMdistribution • M-step: maximizing wrt : • M-step: maximizing wrt : • M-step: maximizing wrt : • function zeros found by inverted numerically
Mappinganglestosymbols • 2) A single trajectory is modeled as a sequence of angles • and after having defined the MoVM • as a sequence of symbols:
Distanceforsequences • We transform a comparison between two sequences of either angles or coordinates in the comparison between two sequences of symbols, with each symbol corresponding to the proper probability distribution • However, due to acquisition noise, uncertainty and spatial/temporal shifts, exact matching between sequences is unsuitable for computing similarity • We use global alignment between two sequences, basing the distance as a cost of the best alignment of the symbols • Dynamic programming techniques are used to speed up the process.
Global alignment • Global vs local alignment • Using global alignment instead of local one is preferable because the former preserves both global and local shape characteristics • Dynamic programming is used to reduce computational time to O (ni · nj), where ni and nj are the lengths of the two sequences.
Inexactmatching • Since the symbols we are comparing correspond to pdf, match/mismatch should be proportional to the distance between the two corresponding pdfs • Need to evaluate distance between two pdfs: • Angular: Von Mises Distributions • Bhattacharyya distance bwpdfs (closed form) • Spatial: Gaussians Distributions • Bhattacharyya distance bwpdfs( )
Sequencesimilarity • where cBis the Bhattacharyya coefficient • The best alignment is then converted in a distance and used for clustering and testing
Comparison of alignment techniques • When the sequences are characterized by different lengths, DTW tries to stretch the two sequences in order to find the optimal time warping path with the consequence of eventually adding additional matches. • Global alignment (based on Needleman-Wunsch algorithm), on the other hand, simply adds gaps to align the sequences leading to the advantage of being more susceptible to slight time series’ changes by controlling the gap cost value
Clusteringtrajectories • The distance is used to cluster the trajectories in the training set either according their shape or they location • k-medoids algorithm: prototype of the cluster is the element that minimizes the sum of intra-class distances • To compute the best number of k clusters, iterative k-medoids: • initialization: i = 0, k(0) = Nt (cardinality training set); each trajectory is chosen as medoid) of the cluster • Step 1: Run k-medoids algorithm with k(i) clusters • Step 2: If there are two medoids with a similarity greater than a threshold Th, merge them and set k(i+1) = k(i)−1. Increment i and go back to step 1.
Experimental Result • We report results on a corpus of 3000 trajectories with an average length of 100 points • We compare our method with the baseline off-line time sequence comparison method of [Keog02] E. Keogh., “Exact indexing of dynamic time warping,” in 28th International Conference on Very Large Data Bases. Hong Kong, 2002, pp. 406–417
Comparison between VS and VLDB approaches • Results on synthetic dataset
Comparison between VS and VLDB approaches • Results on real dataset
Adding the speed • Pure trajectory shape is not sufficiently always discriminative in surveillance scenarios: • the same path covered by a walk or by a run has a different meaning in terms of behavior • Add the speed to the shape description to provide a more complete analysis of the trajectory.
Trajectoryencoding • Foreachcoupleofsubsequentpoint the angle θ and the velocityvectormoduleρ are computed • Foreachcoupleofparameters (θi, ρi) the encodingisperformedusing a polarscheme • Velocitymoduleisusedtochoose the ring and the direction isusedtochoose the sector
Alignment score fortrajectorycomparison • After the polarencoding a trajectory Tiisthenrepresentedas a sequenceofliteralsS={si,1,si,2,si,3…} • Wedefine a suitable score to compare people trajectoriesgiventwosimbolssp,i and sq,j and the correspondingcodes ca1,b1 and ca2,b2 The matching score λi,jisfinallynormalizedto 1 and the similaritymetricξi,jiscomputed
Experiments • We log for training 88 trajectoriesfrom the multicamera system at our campus duringordinaryworkingdays • Wecollect 121 trajectoriesfortestingpurposesbeinglabeledmanuallybyan expert asbelongingtooneof the 12 clusterspreviouslycomputed The classification rate is 74%. Mostoferrors are due totwomainfactors: • First: lackof data in the training set • Second: inherentdifficultiesfor the expert toanswer the question “Whichis the mostsimilartrajectory in the direction and the velocity domain? ”
Experiments Errorexample: S. Calderara, R. Cucchiara, A. Prati, "A DynamicProgrammingTechniqueforClassifyingTrajectories" in Proceedingsof IEEE International Conference on ImageAnalysis and Processing (IEEE ICIAP 2007), Modena, Italy, pp. 137-142, Sept. 10-14, 2007
Trajectorymodeling • Use of semi-directional statistics to jointly model linear (speed) and circular (direction) data • Estimation of precision m in Von Misespdf is troublesome • Using a approximated wrapped Gaussian pdf is preferable: • Similar treatment of its linear counterpart • a linear approximation of the variance parameter even for circular variables: Gaussian MLE to compute the joint multivariate covariance matrix
Checking independence • since directions and speed are dependent:
State of the Art approaches • H. Ding, G. Trajcevski, P. Scheuermann, X. Wang, and E. J. Keogh, “Querying and mining of time series data: experimental comparison of representations and distance measures,” Proceedings of the VLDB Endowment, vol. 1, no. 2, pp. 1542–1552, 2008. • N. Piotto, N. Conci, and F. De Natale. Syntactic matching of trajectories for ambient intelligence applications. IEEE Transactions on Multimedia, 11(7):1266–1275, Nov. 2009. • We choose to test our MoAWLG method against two state of the art approaches: • Point-to-point, Complete, Original: (Ding-Keogh08) (same as before, but with also speed) • Point-to-point, Selected, Transformed: (Piotto09)
(Piotto09) Point-to-point Selected Quantized • The method proposed in (Piotto 09) perform the comparison among selected quantize representations of the original position-speed dataspace. • Characteristic points of the sequences (breakpoints) are extracted: • Temporal Breakpoints: consecutive points in a small area are represented by a single point associated with the time interval the objects stays in its position • Spatial Breakpoints: sudden(a) or slow • curvature changes(b) are selected • as representative points of the trajectory.
(Piotto09) Point-to-point Selected Quantized (2) • Once the breakpoints B are computed two consecutive breakpoints identifies a segment. • Every segment is then associated to a symbol • Where :