Download
1 / 38
380 likes | 500 Views
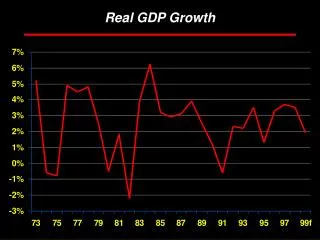
The External Environment for Developing Countries May 2008 The World Bank Development Economics Prospects Group. First quarter GDP growth surprised to the upside across the OECD. real GDP growth, percent saar.

E N D
The External Environment for Developing CountriesMay 2008The World BankDevelopment EconomicsProspects Group
First quarter GDP growth surprised to the upside across the OECD... real GDP growth, percent saar
...but step-up in inflation may pressure growth globally in coming quarters U.S. CPI, Euro Area HICP, median developing-country CPI, ch% y/y Developing countries United States Euro Area Source: National Sources through Thomson/Datastream.
U.S. GDP for Q1-2008surprises to the upside at 0.9% (saar)growth of real GDP, and contributions to growth in percentage points Net exports Change in Stocks Government Consumption Fixed Investment Source: Department of Commerce and DECPG calculations.
Households reticent to spend as wage growth slows... confidence ebbs Personal income and consumption expenditures, ch% saar Personal income Personal consumption expenditure Source: U.S. Department of Commerce.
U.S. inflation underpinned by food, fuels, and imports under a sliding dollarHeadline CPI, PPI- and Import price indexes, ch% 3mma y/y Import price PPI CPI Source: U.S. Department of Commerce.
Japan Q1-GDP surprises to the upside (3.3%) on exports and consumptiongrowth of real GDP, and contributions to growth in percentage points Net exports Fixed Investment Consumption Government Change in Stocks Source: Japan Cabinet Office and DECPG calculations.
Japan’s exports and production take a leg down in April goods export volumes [R], IP manufacturing [L], ch% saar Exports [R] Production [L] Source: Cabinet Office-- Thomson/Datastream.
Japan’s manufacturers and households turn more pessimistic Tankan business conditions [left]; Tokyo consumer confidence [right] Consumer confidence (right) Tankan (left) Source: Bank of Japan and Cabinet Office.
Euro Area Q1-GDP: powered by investment and growth in Germanygrowth of real GDP, and contributions to growth in percentage points Net exports Change in Stocks Fixed Investment Government Consumption Source: Eurostat and DECPG calculations.
European consumer spending continues in the doldrums through Aprilretail sales volumes, ch% 3mma year over year Source: Eurostat through Thomson/Datastream.
HICP near record highs pushed by energy costs HICP [left]; HICP energy [right], ch% year on year HICP Energy [R] HICP [L] Source: Eurostat through Thomson/Datastream.
US industrial production resilient in the first quarter... but growth is softeningindustrial production Forecast Old Forecast Y/Y Q/Q, saar Source: World Bank, DECPG.
Weaker growth in Euro Area hitscountries that export to the Zone industrial production, year-on-year percent change Forecast Czech Republic Turkey Hungary Source: Thomson/Datastream.
Downturn in Chinese industrial production as export growth eases real IP (q/q saar) and exports (3m/3m, oya ) Production Exports Source: Thomson/Datastream.
Indo-Sino trade continues on rapid growth coursegoods exports: millions U.S. dollars China exports to India India exports to China Source: U.N. COMTRADE Database through WITS.
Chinese yuan continues to appreciate against the U.S. dollar in real terms real bilateral exchange rates, ch% year-on-year Real yuan / USD XR Real yuan / Euro XR Source: Thomson/Datastream, DECPG calculations.
Euro Area exports make some headway despite strength of the euro dollar per euro [L]; Euro Zone export volume [R], ch% saar Euro Area Exports [R] Dollar per Euro [L] Source: Eurostat and Thomson/Datastream.
Oil prices soar on expectations of tight markets $/bbl million bbl OECD stocks [R] WB Oil price [L scale] Source: IEA and DECPG Commodities Group.
Distillate prices rise on ultra-low sulfur diesel constraints $/bbl Price differentials relative to crude Distillate Gasoline Crude (WTI) Source: Datastream and DECPG Commodities Group.
WTI Futures Prices - NYMEX Monthly contract prices to Dec 2013* on select dates in 2007-08 $/bbl May 21 2008 Apr 30 2008 Mar 31 2008 Dec 31 2007 Aug 15 2007 Jan 16 2007 * No monthly futures prices for 2013 for contracts trading before Nov 07
Rice prices surge on policy decisions resulting from fear of shortages c/bushel $/ton Wheat Rice Source: Datastream and DECPG Commodities Group.
Copper prices remain firm on low stocks and supply problems $/ton ‘000 tons Copper price LME stocks Source: LME and DECPG Commodities Group.
Freight rates rise on strong demand for bulk materials and port congestion Baltic dry freight index Source: Datastream and DECPG Commodities Group.
Bank lending falls sharply in April Source: DECPG Finance Team.
Trading in EM debt continues decline in 2008 Emerging Market debt trading volume in billions U.S. dollars Eurobonds Local market instruments Source: EMTA and and DECPG calculations.
Emerging market equities: strong in MayEM and high-income equity markets, returns by period (%) Emerging markets High-income markets Source: Bloomberg.
Dollar moves higher on expectations Fed rate cuts finished for near term USD per Euro (inverse) [Left] and Yen per USD [right] yen/USD USD/Euro (inverse) Source: Thomson/Datastream.
A move up in USD LIBOR lends some support to the greenback LIBOR-6 months and EURIBOR 6-months, percent EURIBOR USD LIBOR Source: Datastream and DECPG calculations.
Mixed developments for USD versus range of currencies over 2008 to date change early-June 2008 vs. December 2007, percent Appreciation of Local Currency Source: Thomson/Datastream.
The External Environment for Developing CountriesMay 2008The World BankDevelopment EconomicsProspects Group