Download
1 / 22

E N D
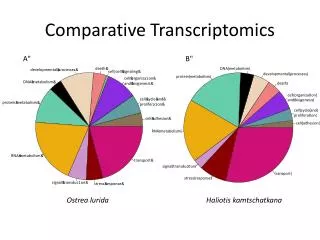
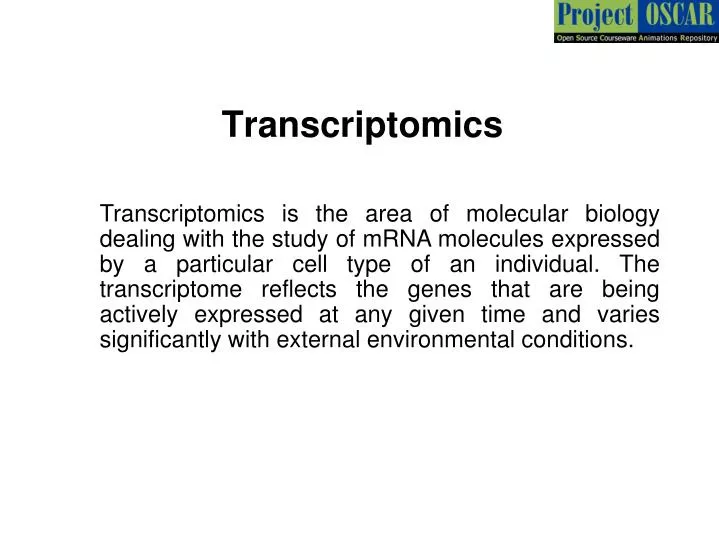
Transcriptomics Transcriptomics is the area of molecular biology dealing with the study of mRNA molecules expressed by a particular cell type of an individual. The transcriptome reflects the genes that are being actively expressed at any given time and varies significantly with external environmental conditions.
Master Layout (Part 1) 1 This animation consists of 3 parts: Part 1 – Reverse transcription PCR Part 2 – Real-time PCR Part 3 – cDNA Microarrays mRNA 2 Reverse transcriptase cDNA First cycle Primer 3 Taq polymerase Second cycle 4 5 Source: Biochemistry by Lubert Stryer, 6th edition (ebook)
Definitions of the components:Part 1 – Reverse transcription PCR 1 1. Reverse transcription PCR: This technique, also known as RT-PCR, is a variation of regular polymerase chain reaction that is used to generate multiple copies of DNA starting from a molecule of RNA. This technique first requires the template RNA strand to be reverse trascribed into the corresponding complementary DNA (cDNA), which is then amplified by traditional PCR. 2. mRNA: mRNA or messenger RNA is a type of RNA molecule that is obtained from DNA on transcription and functions as the template for protein synthesis. It is made up of a sequence of nucleotides, which read three bases at a time by the appropriate enzymes, to give the corresponding protein product. 3. Reverse transcriptase: Reverse transcriptase, also referred to as RNA-dependent DNA polymerase, is an enzyme commonly found in some viruses that is capable of synthesizing DNA from a corresponding single stranded mRNA template. 4. cDNA: cDNA or complementary DNA refers to the DNA molecule that is synthesized from a mature mRNA template by the process of reverse transcription. This DNA will contain only the coding regions and is therefore commonly used for cloning purposes. 5. Primer: A short strand of around 20 nucleotides that acts as a starting point for DNA synthesis by providing a free 3’-OH end. These are hybridized to the target DNA and then elongated by means of the polymerase. 6. PCR cycle: One cycle of PCR refers to one complete round of strand separation at 95oC , annealing at 54oC and elongation at 72oC. 7. Taq polymerase: This is a thermostable DNA Polymerase enzyme that is obtained from the bacterium Thermus aquaticus. It is used for PCR reactions due to its ability to perform DNA elongation even at high temperatures. 2 3 4 5
Part 1, Step 1: 1 Addition of reverse transcriptase & dNTPs Reverse transcriptase 2 cDNA 3 mRNA template dNTPs 4 Action Description of the action Audio Narration Reverse transcription PCR is used to generate multiple copies of DNA with RNA as the starting material. The template RNA molecule is first reverse transcribed into the corresponding cDNA by means of the enzyme reverse transcriptase. This enzyme, which is commonly found in viruses, is capable of synthesizing DNA from an RNA template. As shown in animation. (Please redraw all figures.) First show the green tube on left with label. This must then be zoomed into and the brown strand on top must be shown in the inset. Next the hand must be shown which must move into the tube, add a couple of drops and then disappear. The green oval and colored rectangles must then appear. The oval must move across the brown rectangle as shown. As it moves, the blue strand below must appear gradually. 5 Source: Biochemistry by Lubert Stryer, 6th edition (ebook)
Part 1, Step 2: 1 Addition of dNTPs & Taq Polymerase Addition of primers First cycle 2 5’ 3’ Annealing ~54oC (45 s) Elongation 72oC (2 min) 3 cDNA sample 4 Description of the action Audio Narration Action Traditional PCR is then performed on the cDNA obtained by addition of primers which are allowed to anneal at 54oC. This is followed by addition of nucleotides and Taq Polymerase, which performs elongation of the template strand at 72oC. (Please redraw all figures.) First show the tube on the left which must be zoomed into to show the inset figure on the right with the blue strand. Next the hand must appear & a couple of drops must be added to the tube. The green rectangle must appear along with the text on the right. Next the hand must again appear and enter the tube as shown after which the pink circle & colorful rectangle must appear. The pink circle must then move along the blue strand as shown followed by appearance of the green strand. As shown in animation. 5 Source: Biochemistry by Lubert Stryer, 6th edition (ebook)
Part 1, Step 3: 1 Addition of dNTPs & Taq Polymerase Addition of primers Second cycle 5’ 3’ Strand separation ~ 95oC(1 min) 2 3’ 5’ Annealing ~54oC (45 s) Heating Elongation 72oC (2 min) 3 dsDNA sample 4 Action Description of the action Audio Narration (Please redraw all figures.) Tube on the left must be shown & then zoomed into to show inset on right with the blue & green strands next to each other. The oval below the tube must then turn red to indicate heating during which the two strands must separate. Then the hand must appear and enter the tube as shown. When this happens, the green & violet rectangles must appear next to the blue & green strands respectively. This is followed by movement of hand into the tube again and subsequent appearance of the pink oval and colored rectangles. The oval must then move across the green blue strands as shown which must result in appearance of another green strand next to the blue & a violet strand next to the green as depicted in animation. Second and subsequent rounds of PCR result in further amplification of the cDNA of interest. Strand separation is performed at 95oC followed by primer annealing and elongation respectively. In this way, the mRNA transcript originally used is amplified in the form of its corresponding cDNA which can then be studied further. As shown in animation. 5 Source: Biochemistry by Lubert Stryer, 6th edition (ebook)
Master Layout (Part 2) 1 Reporter This animation consists of 3 parts: Part 1 – Reverse transcription PCR Part 2 – Real-time PCR Part 3 – cDNA Microarrays Quencher Primer Probe Target ssDNA 2 Annealing Fluorescence quenched Taq polymerase Relative fluorescence 3 Polymerization & probe degradation # of cycles Reporter fluorescence 4 5 Source: Biochemistry by Lubert Stryer, 5th & 6th edition (ebook)
Definitions of the components:Part 2 – Real-time PCR 1 1. Real-time PCR: Real-time PCR, also referred to as quantitative real-time PCR (Q-PCR/q-PCR/qrt-PCR), is a molecular biology technique that is capable of quantifying a target DNA molecule as and when it is being amplified. This is done by means of a suitable reporter dye which emits fluorescence every time a PCR cycle is performed and is extremely useful for monitoring gene expression. This technique is finding diagnostic applications that involve the rapid detection of nucleic acids such as infectious diseases or genetic disorders. 2. Target ssDNA: The single-stranded DNA molecule that needs to be amplified and quantified is referred to as the target DNA. 3. Primer: A short stretch of nucleotides (usually RNA) which provides a free 3’ OH end to begin synthesis is referred to the primer. 4. Probe: A stretch of oligonucleotides that detects and binds to a specific DNA sequence within the target strand. A fluorescent reporter dye and a quencher dye are bound to the two ends of the probe molecule. 5. Quencher: The quencher molecule at one end of the DNA probe is responsible for quenching the fluorescence emitted by the reporter dye when it is in close proximity to it. 6. Reporter: The reporter dye bound to one end of the probe emits fluorescence which can be detected only when it moves away from the quencher molecule at the other end of the probe. The increase in fluorescence of the reporter dye with every cycle of PCR is indicative of the increase in number of DNA strands. 2 3 4 5
Definitions of the components:Part 2 – Real-time PCR 1 7. Taq Polymerase: This is a thermostable DNA Polymerase enzyme that is obtained from the bacterium Thermus aquaticus. It is used for PCR reactions due to its ability to perform DNA elongation even at high temperatures. 8. Polymerization & probe degradation: The Taq DNA polymerase performs elongation of the primer based on the sequence of the template DNA and when it reaches the probe molecule, the 5’-3’ exonuclease activity of the enzyme degrades the probe molecule to continue with the elongation. This degradation of the probe molecule into its individual nucleotides results in separation of the quencher from the fluorescent dye, thereby allowing quantification of the DNA. 2 3 4 5
Part 2, Step 1: 1 Addition of primers & probe Addition of dNTPs & Taq Polymerase 2 Strand separation ~ 95oC(1 min) Annealing ~54oC (45 s) Heating 3 Elongation 72oC (2 min) dsDNA sample 4 Action Description of the action Audio Narration The double stranded DNA that needs to be amplified is heated to 95oC to bring about strand separation. Once the strands are separated, primers are added along with the probe DNA molecules, which have the quencher and reporter molecule bound to its ends. Once these have annealed to the template DNA strands at 54oC, Taq Polymerase and nucleotides are added and the temperature is again increased to 72oC to carry out strand elongation. (Please redraw all figures.) First show tube on left which must then be zoomed into to show the inset on right. The oval below tube must turn red to indicate heating & the two colored strands must separate as shown. Next, the hand must appear & enter the tube & then disappear. When this happens, the short strands must be attached to either ends of the separated strands. The hand must then again enter the tube & disappear. The pink oval & colored rectangles must then appear. The pink oval must move in the directions indicated until they reach the fragment at the other end. As the circle moves, the grey arrows shown must appear gradually. As shown in animation. 5 Source: Biochemistry by Lubert Stryer, 6th edition (ebook)
Part 2, Step 2: 1 5’ – 3’ exonuclease activity 2 dsDNA sample 3 Relative fluorescence Increase in fluorescence in real-time PCR is indicative of amount of RNA transcript being produced and is therefore a measure of gene expression. 4 # of cycles Action Description of the action Audio Narration The Taq Polymerase continues to elongate the DNA strand based on the corresponding template DNA. When it reaches the bound probe molecule, the 5’-3’ exonuclease activity of Taq Polymerase degrades the probe into its nucleotide fragments and continues to elongate the DNA strand. The released reporter dye thus gets separated from the quencher molecule during this process and the fluorescence emitted can then be detected using a suitable detector. The increase in fluorescence in real-time PCR is directly indicative of the amount of nucleotide being synthesized and is therefore a useful tool for measuring gene expression. (Please redraw all figures.) As the pink oval reaches the fragment at the other end (end of previous slide), it must continue to move forward. As it moves, each colored rectangle in its path must be released one at a time and the grey arrows must further be extended in both directions. Once the red & green circular molecules are separated from each other, the green molecule must turn bright green & glow. The graph shown on the bottom must then appear along with the text shown. As shown in animation. 5 Source: Biochemistry by Lubert Stryer, 6th edition (ebook)
Master Layout (Part 3) 1 This animation consists of 3 parts: Part 1 – Reverse transcription PCR Part 2 – Real-time PCR Part 3 – cDNA Microarrays Cy3 2 mRNA cDNA Cy5 Microarray 2. Reverse transcription & labeling 3 1. DNA Array printing A G C C C T G T A G G C C C G C G T A G C 4 cDNA 3. cDNA hybridization 5 4. Array scanning Source: Biochemistry by A.L.Lehninger, 4th edition (ebook)
Definitions of the components:Part 3 – Microarrays 1 1. Control: The control refers to those samples of cells/tissues that are normal without any underlying conditions that might bring about changes in gene expression. 2. Test: The test sample refers to those which may show changes in gene expression due to a disease/disorder. 3. mRNA extraction: Gene expression studies are carried out by studying the mRNA transcripts. mRNA can be extracted by means of addition of a lysis buffer to the system which will break open cells followed by centrifugation at a suitable speed to pellet out cell debris. 4. Reverse transcription: The process by which mRNA is converted to cDNA.Reverse transcriptase, also referred to as RNA-dependent DNA polymerase, is an enzyme commonly found in some viruses that is capable of synthesizing DNA from a corresponding single stranded mRNA template. 5. cDNA: cDNA or complementary DNA refers to the DNA molecule that is synthesized from a mature mRNA template by the process of reverse transcription. This DNA will contain only the coding regions and is therefore commonly used for cloning purposes. 6. Cyanine dyes (Cy3 & Cy5): These are organic dyes that are used for differential labeling of samples which can then be mixed together and studied. The two dyes are excited at different wavelengths which allows the labeled samples to be identified separately. 7. Microarray: A microarray is a two dimensional array on a solid surface, usually glass, which is used to study and analyze large number of samples simultaneously in high throughput. A cDNA microarray consists of DNA molecules hybridized to the array surface, which are used for further studies. 8. Scanning: The microarray slides are scanned at a suitable wavelength depending upon the labeling molecule using a scanner. 2 3 4 5
Part 3, Step 1: 1 DNA Array printing Robotic arm 2 3 96-well plate containing DNA Microarray slide DNA Oligos printed on array surface G C G T A G C 4 Action Audio Narration Description of the action A DNA microarray is printed with oligonucleotide sequences that will serve as probe molecules by providing complementary strands for binding cDNA of interest. Thousands of such spots, each containing as little as picomole quantities of DNA, can be printed on a single slide. Commonly used binding chemistries for printing include covalent attachment via epoxy-silane, amino-silane, polyacrylamide etc. As shown in animation. (Please redraw all figures.) First show the ‘microarray slide’, ‘96-well plate’ & robotic arm in the chamber as shown. The robotic arm must then enter the ‘96-well plate’, withdraw sample and then move to the array surface to print on it as shown. An inset showing one of the array spots in zoomed in mode must then be shown which must contain the figures on the grey surface as shown below (oligos). 5
Part 3, Step 2: 1 mRNA extraction Lysis buffer & centrifugation 2 Control sample mRNA 3 Lysis buffer & centrifugation mRNA Test sample 4 Action Description of the action Audio Narration As shown in animation. The mRNA present in the control and test samples is extracted by addition of a lysis buffer which breaks open the cells. Centrifugation helps in pelleting downthe cell debris after which the mRNA present in the supernatant can be transferred into a fresh tube for further analysis. First show the two tubes on the left with labels followed by the arrows emerging from them as shown followed by the tube on the right with the wavy lines towards the top of the solution and the remaining components forming a pellet at the bottom. The hand must then appear which must enter the tubes and the liquid on top must be sucked out into the pipette tip and then transferred to the empty tube placed next to it as shown. 5 Source: Biochemistry by A.L.Lehninger, 4th edition (ebook)
Part 3, Step 3: 1 Reverse transcription 2 ControlmRNA cDNA 3 mRNA Reverse transcriptase Test mRNA 4 Action Description of the action Audio Narration The tubes on left must be shown followed by the hand with pipette appearing on top of both tubes. A couple of drops must fall into the tubes in the form of the brown oval as shown. The red box must appear which must be zoomed into to show the inset figure on the right with the ‘mRNA’ strand and the oval . The oval must move across the strand as shown and as it moves, the colored rectangular shapes must be added to the opposite strand one at a time. This part has not been depicted in the animation. As shown in animation. The extracted mRNA is then reverse transcribed into its corresponding cDNA by means of the enzyme reverse trasncriptase. This enzyme, which is also known as RNA dependent DNA polymerase, is capable of synthesizing DNA from a corresponding RNA template. 5 Source: Biochemistry by A.L.Lehninger, 4th edition (ebook)
Part 3, Step 4: 1 Labeling Cy5 2 Control cDNA Mix samples 3 Cy3 Test cDNA 4 Action Audio Narration Description of the action The control and test cDNA samples obtained are then labeled with Cy5 and Cy3 dyes respectively. Since the two dyes can be excited at different wavelengths, the differentially labeled samples are then mixed together for further analysis. As shown in animation. First show the tubes on the left followed by the arrows emerging from them with the colored circles. These must enter the tubes to give the figures shown in the middle panel. The contents of these two tubes must then be mixed together into another tube as shown on right. 5 Source: Biochemistry by A.L.Lehninger, 4th edition (ebook)
Part 3, Step 5: 1 Hybridization & incubation Cover slip 2 Printed DNA microarray 3 Labeled cDNA cDNA Hybridization A G C C C T G T Oligos printed on array surface A G G C C C G C G T A G C 4 Action Audio Narration Description of the action The mixed cDNA sample that is differentially labeled by means of the two cyanine dyes is then incubated with the printed DNA microarray slide. This allows hybridization to occur between the probe oligonucleotides on the array surface and the labeled cDNA samples of interest. As shown in animation. (Please redraw all figures.) First show the ‘microarray slide’, ‘96-well plate’ ‘labeled cDNA’ & robotic arm in the chamber as shown. An inset showing one of the array spots in zoomed in mode must be shown which must contain the figures on the grey surface as shown (oligos). The robotic arm must then enter the tube, withdraw some sample and then move to the ‘96-well plate’ where the sample must be added to the wells. The arm must then move into the wells, withdraw some sample and then move to the array surface to print on it as shown. Once this happens, the cDNA must appear in the inset where it must bind to the sequence below on the grey surface as depicted. 5
Part 3, Step 6: 1 Scanning Scanner 2 3 Data analysis Up-regulation Down-regulation Microarray slide 4 Action Audio Narration Description of the action As shown in animation. The microarray is washed to remove any unbound cDNA molecules and then scanned at suitable wavelengths by means of a microarray scanner. Cy3 labeled samples are excited at a wavelength of around 550 nm while Cy5 labeled samples are excited at 650 nm. The expression levels will give an indication of genes that are being up-regulated or down-regulated in the samples. This can also be used in determination of mRNA expression at different stages of cell growth and differentiation. (Please redraw all figures.) First show the image of ‘scanner’ and the microarray slide placed below it. The green beam must then appear on the array slide from the scanner which must light up some of the spots on the array surface (not shown here). Next the red beam must appear which must light up some other spots on the surface. This is followed by appearance of the computer image on the right along with the text below as shown. 5 Source: Biochemistry by A.L.Lehninger, 4th edition (ebook)
Interactivity option 1:Step No: 1 1 Match the temperatures given on the left with the correct step of PCR mentioned on the right. Step of PCR Temperature 2 1. Strand separation 54oC A) 2. Primer annealing 72oC B) 3 C) 92oC 3. Elongation 4 Results Interacativity Type Options User must be allowed to drag and drop the temperatures mentioned on left into the dotted boxes on the right. User must drag & drop the temperatures provided in the left column into the dotted boxes present in the right column. Every time the user drags one correct temperature into the box, that box must then turn green. If user gets it wrong, then it must move back automatically into the left column. Correct answers are 1 – C, 2- A & 3-B. Drag & drop. 5
Questionnaire 1 1. Which of the following enzymes carries out synthesis of DNA from an RNA template? Answers: a) DNA polymerase b) DNA primase c) Reverse transcriptase d) RNA polymerase 2. The excitation wavelength of Cy3 dye is? Answers:a) 550 nm b) 650 nm c) 670 nm d) 600 nm 3. Which of the following enzymes is thermostable? Answers:a) Reverse transcriptase b) RNA polymerase c) Taq polymerased) None of the above 4. Which PCR technique enables quantification of target amplification as it is being carried out? Answers:a) Reverse transcription PCR b) Conventional PCR c) Multiplex PCR d) Real-time PCR 2 3 4 5
Links for further reading Books: • Biochemistry by Stryer et al., 6th edition • Biochemistry by A.L.Lehninger et al., 4th edition • Biochemistry by Voet & Voet, 3rd edition Research papers: • Saiki, R. K. et al. Primer-directed enzymatic amplification of DNA with a thermostable DNA polymerase.Science 239 (4839): 487–91. • Nolan T, Hands R. E., Bustin S.A. Quantification of mRNA using real-time RT-PCR. Nat. Protoc. 2006, 1 (3): 1559–1582. • Spackman, E. & Suarez, D. L. Type A influenza virus detection and quantitation by real-time RT-PCR. Methods Mol. Biol. 2008, 436:19-26. • VanGuilder H. D., Vrana K.E., Freeman W.M. Twenty-five years of quantitative PCR for gene expression analysis. Biotechniques 2008, 44 (5): 619–626. • Duggan, D. J. et al., Expression profiling using cDNA microarrays. Nat Genet. 1999, 21 (1 Suppl.):10-4.