Download
1 / 65
660 likes | 829 Views
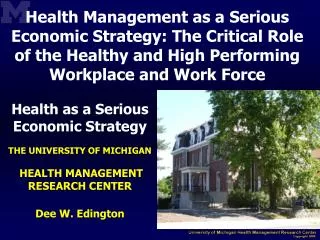
Health Management as a Serious Business Strategy. Dee. W. Edington. THE UNIVERSITY OF MICHIGAN HEALTH MANAGEMENT RESEARCH CENTER. UM-HMRC Corporate Consortium. Kellogg JPM Chase Progressive We Energies General Motors Foote Health System Medical Mutual of Ohio St Luke’s Health System

E N D
Health Management as a Serious Business Strategy Dee. W. Edington THE UNIVERSITY OF MICHIGAN HEALTH MANAGEMENT RESEARCH CENTER
UM-HMRC Corporate Consortium • Kellogg • JPM Chase • Progressive • We Energies • General Motors • Foote Health System • Medical Mutual of Ohio • St Luke’s Health System • Cuyahoga Community College • Blue Cross Blue Shield Rhode Island • United Auto Workers-General Motors • Wisconsin Education Association Trust • Southwest Michigan Healthcare Coalition • Australian Health Management Corporation • Crown Equipment • Delphi Automotive • Southern Company • Florida Power & Light • Affinity Health System *The consortium members provide health care insurance for over two million Americans. Data are available from eight to 18 years. Meet on First Wednesday of each December in Ann Arbor
New way to do Health and Productivity Management In the United States and Throughout the World UM-HMRC Ann Arbor X
Next Generation Health Management, Champion Companies, Zero Trend • Total Case: Research to Business Case to Application Workshop • -Eight hours of presentation and interactive discussion • Total Case: Business Case to Application Workshop • -Four hours of presentation and interactive discussion • Business Application Seminar: (120 minutes) • Business Application Presentation: (75 minutes) • Business Application Presentation: (60 minutes) • Executive Summary Presentation: (30 minutes)
Agenda • Health Management as a Serious Business Strategy • Michigan PHA: September 21, 2006 • Introductory Comments • Do-Nothing Strategy • Business Concepts to Build the Business Case • Next Generation Programming • Slides available via e-mail attachment
Why are You Here? Health Management as a Business Strategy Along the way, “…someone moved the cheese…” Health or Economics? Healthy People or Productive People?
Two Questions • Why do I have Health Insurance? • 2. Who is in the center of the Healthcare Industry?
Moving the Paradigm From “The Cost of Healthcare” (Treating disease) To “The Total Value of Healthcare” (Managing health status) To “Health is Free” (Healthcare Costs < Total Benefits) Adopt the Quality Strategy: Fix the Systems
Section I The Do-Nothing Strategy
The Natural Flow of Health Risks and Behaviors
Health Risk Measure Alcohol Blood Pressure Body Weight Cholesterol Existing Medical Problem HDL Illness Days Life Satisfaction Perception of Health Physical Activity Safety Belt Usage Smoking Stress High Risk Criteria More than 14 drinks/week Systolic >139 or Diastolic >89 mmHg BMI 27.5 Greater than 239 mg/dl Heart, Cancer, Diabetes, Stroke Less than 35 mg/dl >5 days last year Partly or not satisfied Fair or poor Less than one time/week Using safety belt less than 100% of time Current smoker High Health Risks and Behaviors OVERALL RISK LEVELS Low Risk 0 to 2 high risks Medium Risk 3 to 4 high risk High Risk 5 or more high risks
2,373 (50.6%) 4,691 (10.8%) 1,961 (18.4%) 5,226 (12.1%) 892 (3.2%) 4,546 (42.6%) 10,670 (24.6%) 1640 (35.0%) 678 (14.4%) 11,495 (26.5%) 5,309 (19.0%) 4,163 (39.0%) 27,951 (64.5%) 26,591 (61.4%) 21,750 (77.8%) Risk Transitions Time 1 – Time 2 High Risk (>4 risks) Medium Risk (3 - 4 risks) Low Risk (0 - 2 risks) Mean of three years between measures Modified from Edington, AJHP. 15(5):341-349, 2001
The Natural Flow of Health Care Costs
37,701 (55.7%) High Cost ($5000+) 67,680 (19.0%) 26,288 (20.6%) 73,427 (20.6%) Medium Cost ($1000-$4999) 9,438 (5.9%) 75,500 (59.1%) 127,644 (35.8%) 23,043 (34.0%) 6,936 (10.2%) 130,785 (36.7%) 32,242 (20.0%) 25,856 (20.3%) 160,951 (45.2%) 152,063 (42.7%) Low Cost (<$1000) 119,271 (74.1%) Cost Transitions Time 1 – Time 2 N=356,275 Non-Medicare Trad/PPO Modified from Edington, AJHP. 15(5):341-349, 2001
Total Medical and Pharmacy Costs Paid by Quarter for Three Groups Musich,Schultz, Burton, Edington. DM&HO. 12(5):299-326,2004
- - Non Participant Costs Associated with Risks Medical Paid Amount x Age x Risk High Risk Medium Risk Low Risk Edington. AJHP. 15(5):341-349, 2001
This is the Way Americans Have been Living their Lives for 60 Years Are We Willing to Accept the Consequences of the Do-Nothing Strategy?
Section II Key Business Concepts To Build the Business Case
Business Concept Total Value of Health Status
Relative Costs of Poor Health: Total Value of Health Direct Costs: Medical & Pharmacy Indirect Costs: Worker’s Compensation Presenteeism LTD STD Absenteeism Time-Away-from-Work Edington, Burton. A Practical Approach to Occupational and Environmental Medicine (McCunney). 140-152. 2003
Same Risk and Behavior Factors Drive All the Outcome Measures
Medical/Drug Cost Comparison by Risk Status *p<.05. Yen, Witting, Edington. AJHP. 6:46-54, 1991
Total Disability Cost by Risk Status 1998-2000 Mean Annual Costs Wright, Beard, Edington. JOEM. 44(12):1126-1134, 2002
Estimated Loss of Productivity by Risk Status Burton, Chen, Conti, Schultz, Pransky, Edington. JOEM. 47(8):769-777. 2005 *p<.05, **p<.01
Business Concept Excess Costs follow Excess Risks
Excess Medical Costs due to Excess Risks $5,520 $3,460 $3,039 $2,199 Edington, AJHP. 15(5):341-349, 2001
Excess Disability Costs due to Excess Risks $1,248 $783 $666 $491 36% of Absence, STD, Worker’s Comp Wright, Beard, Edington. JOEM. 44(12):1126-1134, 2002
Excess On-The-Job Loss due to Excess Risks 14.7% Burton, Chen, Conti, Schultz, Pransky, Edington. JOEM. 47(8):769-777. 2005
Business Concept Total Value of Health Status to an Organization
Association of Risk Levels with Corporate Cost Measures Wright, Beard, Edington. JOEM. 44(12):1126-1134, 2002
Business Concept Stratification of the Population for Intervention
Stratification In the Health Promotion Opportunity Health Promotion Opportunity
0.9 Low intervention (71%) Se=0.83 0.83 High Intervention (29%) Se=0.79 0.8 0.79 0.75 Se=0.75 0.7 0.64 0.6 0.57 0.54 0.52 0.5 % 0.4 0.3 0.2 0.19 Sp=(1-0.10)=0.90 0.18 0.18 Sp=(1-0.07)=0.93 0.10 0.14 0.1 0.07 Sp=(1-0.14)=0.86 0.08 Sp=(1-0.08)=0.92 0 base t1 t2 t3 t4 t5 t6 Se=Sensitivity Sp=Specificity Time Predictability to be at High Cost
Business Concept Change in Costs Follow Change in Risks
Change in Costs follow Change in Risks Cost increased Cost reduced Risks Reduced Risks Increased Overall: Cost per risk reduced: $215; Cost per risk avoided: $304 Actives: Cost per risk reduced: $231; Cost per risk avoided: $320 Retirees<65: Cost per risk reduced: $192; Cost per risk avoided: $621 Retirees>65: Cost per risk reduced: $214; Cost per risk avoided: $264 Updated from Edington, AJHP. 15(5):341-349, 2001.
Change in Presenteeism follows Change in Risks percent increased Percent reduced Risks Reduced Risks Increased Burton, Chen, Schultz, Edington 48:252-263, 2006.
Business Concept Change in Costs Follow Engagement
Cost Savings Associated with Program Involvement from 1985 to 1995 Annual Increase = 12.6% Annual Increase = 4.2% Zero or One HRA (N=804) Two or More HRAs (N=522) Programming Year
The average annual increase in absence days (1995 – 2000): Participants: 2.4 Non-Participants: 3.6 1.2 Work Days Participant Year $200 Work Day $623,040 Year X X 2,596 participants = Yearly Average Disability Absence Days by Participation Pre-Program Program Years Schultz, Musich, McDonald, Hirschland,Edington. JOEM 44(8):776-780, 2002
Section III Health Management as a Serious Business Strategy Next Generation Program Healthy Companies Zero Trend
Three Key Business Beliefs • Individuals Can Maintain Low-Risk Health Status even as they Age • An Employer and a Health Plan can Help its Members Maintain Low-Risk Health Status • The Major Economic Benefit is in Paying Attention to Individuals with Low-Risk Health Status
Strategies for Population Management
Where are the Opportunities for Population Health Management? Medical & Care Management Opportunity Disease Management Opportunity Health Promotion Opportunity Medical and Drug Costs only
Health Advocate • Provide Direction • Get the Care You Need • Coaching & Outreach Health Plan Design Environmental Design • Behavioral Health • Work/Family • Work Life Plus • Disease Management • High Acuity (identified high cost disease) • Low Acuity (identified lower cost disease; lifestyle behavior focus) • Health Portal • Stay healthy • Health information • Make informed choices Total Health & ProductivityManagement • Health Risk Assessment • Assess and track health behaviors • Maintain health • Address health risks Case Management • STD, LTD • Workers’ Compensation • Scattered Absence • Fitness Centers • Low risk maintenance • High risk reduction Absence Management • Wellness Programs • Active expansion • Retiree communications/awareness program • On-site Medical • Diabetes education pilot • Injury and medical management Create an Integrated and Sustainable Approach Long Term Strategy—Short Term Solutions
Health Management as a Serious Business Strategy Worksite Environment Values and Beliefs Workplace Policies Benefit Design Population Website Health Policies Special Promotions Employee Assistance Risk Reduction Activities Low-Risk Maintenance Know Your Numbers Physical Activity Nutrition Awareness Medical Facility Individual (Stratification by Individual) Coaching Sessions Low-Risk Maintenance Disease Management High-Risk Reduction Health Advocate Triage to Resources Health Risk Appraisals Incentives Measurement
Management and Leadership of the Company and Unions Mission and Values Aligned with a Healthy and Productive Culture Policies and Procedures Aligned with Healthy and Productive Culture Vending Machines Job Design Cafeteria Flexible Working Hours Stairwells Smoking Policies Other Environment Interventions(Physical, Psycho/Socio)
Next Generation Benefit Design to Promote Consumerism • Values, Mission,… “What’s the Point • Move from Entitlement to Consumer • Incentives follow Actionable Behaviors • Provide Transparency • Appropriate Physicians • Appropriate Health Systems • Appropriate Pharmaceutical Solutions • Promote Maintenance of Health Status
Next Generation of Individual Based Programs