Download
1 / 21
220 likes | 370 Views
Rotation Tests - Computing exact adjusted p-values in multiresponse experiments. Øyvind Langsrud , MATFORSK, Norwegian Food Research Institute. Campylobacter experiment. Three biological replicates (block variable) 312 FT-IR wavelengths as multiple responses

E N D
Rotation Tests - Computing exact adjusted p-values in multiresponse experiments Øyvind Langsrud, MATFORSK, Norwegian Food Research Institute.
Campylobacter experiment • Three biological replicates (block variable) • 312 FT-IR wavelengths as multiple responses • polysaccharide region [1200-900 cm-1]
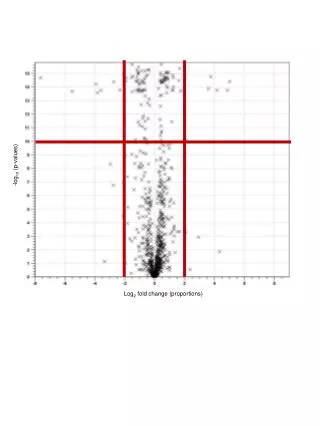
Effect of Day - 312 single response p-values • Ordinary significance tests are not longer suitable • A lot of significant results cased by random variation (since several tests/responses) • The p-values need to be adjusted • So that they are interpretable
Adjusted p-values • So that experimentwise (or familywise) error rate is controlled • Bonferroni correction (classical method) • pAdj = #responses • pRaw • Conservative upper bound (in practice often too conservative ) • Dependence among responses not investigated • Modern methods • Makes active use of dependence among responses • Permutation tests • Rotation tests
Assume a regression model(simplified model without constant term) • Separate F-tests for each response • Random variables: F1, F2 … , Fq • Observed values: f1, f2 … , fq • Maximal F-value (= minimum p-value) obtained for response number k • Raw p-value: • Adjusted p-value:
Adjusting the minimum p-value by permutations • For m=1,2 …. M • permute data (Y P(m)Y ) • compute maximal F-statistic from these data • Compute p-value as
How is dependence handled? • Estimate of covariance matrix under H0: • Estimate based on permuted data: • The permutation test is a conditional test • Conditioned on the covariance matrix estimate • Conditioned on sufficient statistics for the unknown parameters • Fisher's exact test for 22 contingency tables • is the most famous conditional test
Conditional test under multivariate normality? • Need distribution of Y conditioned on YTY • Answer • Y is distributed as RYobs • where Yobs is the observed matrix • and where R is an uniformly distributed orthogonal matrix (random rotation matrix) • Relation to well-known tests • t-test, F-tests, Hotelling T2, Wilks’ are special cases of rotation testing • But these test statistics do not depend on YTY • Conditioning not needed • Simulations not necessary
Adjusting the minimum p-value by rotations • For m=1,2 …. M • simulate rotated data (Y R(m)Y ) • where R(m) is a simulated random rotation matrix • compute maximal F-statistic from these data • Compute p-value as • In practice: a much more efficient algorithm is applied
Adjusting the other p-values (permutations or rotations) • Remove response with minimum p-value • Adjust minimum p-value in new data set • and so on • Enforce monotonicity • All calculations can be done simultaneously
Permutation test or rotation test • Exact permutation testing • The only assumption: independent observations • Useless for few observations • Useless for complex ANOVA and regression models • Exact rotation testing • Assumes multivariate normality • Does not need as many observations as permutation testing • Can be use for complex ANOVA and regression models • F-test rotation test
Adjusted p-values (FWE) • non-adjusted p-values (RAW) • False significance at 1% level is expected in 1% of all the investigated responses • If you have 5000 responses ….. • “Classically ” adjusted p-values (FWE) • False significance at 1% level is expected in not more that 1% of all experiments where the method is applied. • The experimentwise (or familywise) error rate is controlled
False Discovery Rate (FDR) • Adjusted p-values according to False Discovery Rate • False significance at 1% level is expected in 1% of all cases (responses) reported as significant at 1% level. • If you have 5000 responses and 200 are reported as significant at 1% level, one will expect two of these as false. • “q-values” is proposed instead of “adjusted p-values”
Calculation of FDR adjusted p-values • Several methods exist • Most of them do not handle the dependence among the responses • but OK if the “weak dependence requirement” is met • New variant • based on rotations (or alternatively permutations) • handles any kind of dependence • conservative compared to other methods • since the method does not involve an estimate of the amount of responses with true null hypotheses
Rotation Tests - Conclusion • Simulation principle for computing exact Monte Carlo p-value for any test statistic. • Based on multivariate normal distribution. • Generalisation of classical tests. • Related to permutation testing. • Useful for computing adjusted p-values (F-tests) • FWE, FDR • General linear models (ANOVA and regression) • Implemented in the 50-50 MANOVA program (www.matforsk.no/ola)