Download
1 / 48
480 likes | 606 Views
Alcohol and British Society 12 th March 2013 A tale of two cities Jonathan Chick and Jan Gill Queen Margaret University Edinburgh. Outline. Policy/legislation background Our study: alcohol purchasing by ill heavy drinkers Rationale and design

E N D
Alcohol and British Society 12th March 2013 A tale of two cities Jonathan Chick and Jan Gill Queen Margaret University Edinburgh
Outline • Policy/legislation background • Our study: alcohol purchasing by ill heavy drinkers • Rationale and design • Some preliminary findings.
Framework for Action- Addressing Scotland’s Relationship with Alcohol 2009 onwards Education and awareness, additional investment for treatment and care services, Alcohol and Drug Partnerships ABIs (primary care brief interventions) delivered with funding !
Licensing (Scotland) Act 2005 • Implemented 2009 (Test purchasing, mandatory training for staff, ban on irresponsible promotions in the on-trade, restriction on place of display in off-trade etc).
Alcohol etc (Scotland) Act 2010 – Implemented Oct 2011 • Ban on quantity discounts in off-sales • Restrictions on alcohol display and promotions in off sales. • Mandatory Challenge 25 age verification policy. • Health Boards to be notified of premises licence applications. • etc
Alcohol (Minimum Pricing) (Scotland) Act 2012 – MUP (minimum price per unit of alcohol):all alcohol sold through licensed premises in Scotland Proposed 50 pence- to be reviewed every 2 years Will expire after 6 years unless provision made for it to continue after the end of 5 years by Scottish Government (‘Sunset Clause’) Will not be implemented until current Scottish judicial proceedings concluded
Predicted benefits of a 50p/unit min. price(Sheffield University: modelling based on previous national and international data) overall Scottish consumption by 7.2% Scottish hospital admissions by 8,900 10 years total societal cost (crime, health, by £1.3 billion)
Legislated but not yet implemented Judicial Review underway following legal challenge to the Scottish Government (began Tuesday 15th January) ( by the Scotch Whisky Association – representing large producers of distilled spirits )
MUP date • April 2012 • April 2013 • ?
The current scenario • Recession • Falling real incomes • Reducing social security benefits • Possibly strategic price adaptations by producers or retailers
Affordability increased by 45% from 1980-2007 (nb rising disposable income) Sales (Scot Eng )follow affordability Figure from MESAS, 2012
Evaluating effects of minimal pricing on health • Sales data • Hospital discharge data/ mortality data • General population surveys (but heavy drinkers’ under-represented) • Monitor possible unwanted effects: dependent drinkers: substitute alcohols/other drugs/stealing/smuggling/illicit distilling ?
QMU StudyBeverage purchasing and effects of minimum pricing among 600 heavy drinkers attending hospitals in Glasgow and Edinburgh MUP Supplemented with Qualitative interviews Original Plan.
MUP MUP ? Supplemented with Qualitative interviews Revised study.
Inclusion criteria Attending an alcohol problems service out-patient appointment or Admitted to hospital, and having a diagnosis of an alcohol-related condition (whether or not another diagnosis has also been made)
Exclusion • under 16 years old; • unable to understand the questions or give understandable answers in English; • clinically significant memory impairment e.g. Korsakov's dementia; • unwilling to be contacted for 3 further follow-up interviews.
Alcohol drunk and price paid Drinks questionnaire ; last 7 days of last period of drinking using the Time Line Follow- Back method (beverage, volume purchased, cost and location (off/on/free/ home brewed etc) of purchase for each day. From this, and using manufacturer’s data, the price per ‘unit’ (8 gram) of ethanol was calculated.
Illicit, substitute, smuggled or stolen? Any illicit drugs? What alcohol-related disorder linked to that admission/consultation? (Also Record Linkage to NHS and mortality records )
Some preliminary findings • Drinking, purchasing and harms among sick drinkers • Between-city differences • Determinants of inequalities in harms • Purchasing during era of decreasing affordability
The ‘Glasgow Effect’ Reduced life expectancy in Glasgow (e.g. males 5.4 years lower than in Edinburgh in 2001) Relates to social deprivation, and is particularly accounted for by suicide, drug deaths and alcohol liver disease Leyland et al
Between city differences : causes of problems SES is more predictive of ARPQ in Edinburgh (OR 0.9, p<.001) than Glasgow (OR 0.6, n.s.) Consumption is more predictive of ARPQ in Edin than Glasgow i.e. Is there is something else in Glasgow, in addition to low SES, that contributes to problems, especially mental health problems .. A ‘Glasgow effect’?
Between city differences: Source Purchasing from ‘Independent’ outlets) (‘corner shops’) predicted ‘problems’ in Edinburgh, not Glasgow ; but MUCH commoner in Glasgow:
Social economic class (SES) inequalities (2) Mental health problems (OR 1.97,p< .001), not liver problems (OR 1.12, n.s)., linked to lower SES SES not a predictor of health problems among women (viz: Females were more likely than men to be from higher SES - OR 0.62, p<.05)
In the wider population, sales followaffordability Figure from MESAS, 2012
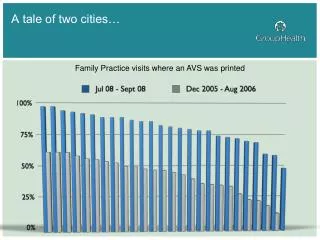
% of all off-sales units purchased at or below 50 pence/unit
i.e. moderate drinkers are following their preferred beverages into a higher price range, and overall are reducing consumption; ..........while very heavy drinkers stay purchasing cheaply for as long as they can. Patients are resisting the current downward trend in affordability, because the cheap alcohol is still there.
The proportion of their consumption that patients buy at less than 50p/unit has INCREASED while affordability has fallen ...because those purchases (those products!) are still available
Future work • Linkage with NHS hospital and with Deaths Register (nb 22 deaths already documented in in first 3 months of recontacting) • Trends in drink purchasing against background UK economic changes (incl benefits) and marketing fashions • Profiling the drinker resistant to treatments/ and changes in the sourcing of alcoholic beverages in the UK • ??effects of MUP
Heather Black - Leading RA; conducted the Pilot Robert Rush (statistician) Fiona O’May (research fellow) Christine Galloway , Shauna Kielty (RAs Edinburgh) Cheryl Rees and Jane Doogan (RAs Glasgow) Prof Barbara McPake (economist) Lucie Michalova (coordinator) Rebecca Lawrence , Helen Leslie (Edinburgh) Iain Smith, George Benson, Ewan Forrest, Frances Skelton (Glasgow)
GET GRAPH FROM ISD ( NRS) Alcohol-Related deaths by area deprivation In 2007, alcohol-related mortality rates in the most deprived SIMD category were over seven (7.1) times higher than in the least deprived category (59/100,000 population compared to 8/100,000 population). By 2011, the relative difference had reduced to 5.4 (45/100,000 population compared to 8/100,000 population). Trends in rates across quintiles have varied. For example, there has been a marked downward trend in the most deprived quintile, decreasing from 59/100,000 population in 2007 to 45/100,000 population in 2011 (a 24% fall). In contrast, rates in the least deprived quintile remained static (at 8/100,000 population) (Figure 6.5). Figure 6.5: Alcohol-related deaths (underlying cause), by deprivation category, 2007 - 2011 Source: ISD Scotland (NRS).
Proportion of each drinks category sold in the off-trade below different prices per unit, 2008-2011 (MESAS, 2012) • All alcohol Spirits Wine Beer Cider • <30ppu • 2008 22 27 8 25 53 • 2009 14 13 4 18 46 • 2010 10 3 2 18 43 • 2011 6 1 1 10 34 • <40ppu • 2008 57 71 38 60 78 • 2009 50 63 34 50 74 • 2010 43 53 25 48 70 • 2011 35 37 20 43 62 • <50ppu • 2008 81 88 72 85 86 • 2009 77 84 68 79 86 • 2010 72 79 62 76 82 • 2011 66 76 52 72 79
Week’s consumption (Mean) Scottish general population (Adults 16 years or older) from sales data: 23.5 units from Scottish Health Survey: 11.6 units Our sample 215.0 units
The White Cider drinkers Greater proportion of males in this group than non white cider drinkers, p = 0.014). But no differences between the cities in gender distribution of white cider drinkers.
Scottish general population: Trend towards less sales at below 50ppu In 2008, 81% of all off-trade alcohol was sold at less than 50ppu, falling to 66% in 2011. • At the upper end of the price distribution, 95% of all off-trade alcohol was sold at less than 70ppu in 2008, falling to 91% in 2011. • For instance, there was a 22% point decrease between 2008 and 2011 in the proportion of alcohol sold at less than 40ppu, compared with only a 4% point drop in the proportion sold at below 70ppu. But the proportion that patients are buying at that level has INCREASED not decreased ...because those purchases can still be made. There are fewer products at 9p/unit, but still 14p/unit
Inequalities in male mortality by occupational class, perceived status and education in Russia, 1994-2006. • Eur J Public Health. 2012 Jun;22(3):332-7. doi: 10.1093/eurpub/ckr130. Epub 2011 Sep 21. • Bessudnov A, McKee M, Stuckler D. • Russia's market reforms in the early 1990s led to marked social inequalities. We analysed inequalities in risks of dying for Russian men by occupational class and perceived social status in the post-transition era. • METHODS: • Cox proportional analysis of the hazard of dying by occupational class, education, household income and perceived social status was performed for 593 deaths that occurred between 1994 and 2006 using a representative sample of Russia's male population (n = 6586 people, 40 046 person-years). Occupational class was coded based on the European Socio-Economic Classification; social status was based on survey questionnaires about people's perceived economic, power and respect status. • RESULTS: • Manual occupational class is significantly associated with greater hazards of dying among men, after adjusting for age, education and other potential confounding variables. Groups at highest risk were men who were manual workers, manual supervisors and technicians, and lower sales and service workers. Substantial gaps in life expectancy at age 21 of up to 10 years were observed between male managers and professionals and manual workers.