Download

1 / 26
260 likes | 406 Views
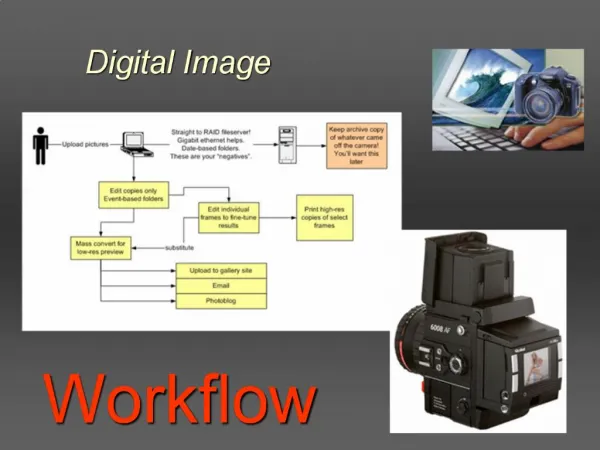
The Digital Image. The Digital Image. Majority of images don’t originate in the digital form, mostly in the form of optical light energy Before we can process an image digitally it must be in digital form

E N D
The Digital Image • Majority of images don’t originate in the digital form, mostly in the form of optical light energy • Before we can process an image digitally it must be in digital form • Optical images: human sight, video camera, photograph, also X-ray, infrared, radar, and acoustic images.
Creating a Digital Image • A ”natural” image is composed of varying array of shades and colors • In photograph shades from ligth to dark and colors from reds through yellows to blues • Continuous-tone image, compiled from various shades and colors blended with no disruptions
A digital image is composed of discrete points of gray tone, or brightness, not continuosly varying tones • To convert a image as digital, the orginal image must be divided into individual points of brightness, with a specific digital data value • Sampling and Quantization = image digitization
An Image is sampled into a rectangular array of pixels • Each pixel has coordinates corresponding to its location within the image • x = pixel number, y = line number • The digital image actually exists as a large array of numbers (bits) • In gray-scale 0 to 255 • 0 = 0000 0000 • 255 = 1111 1111 • Quality is directly related to the amount of pixels and lines, along with the range of brightness values = image resolution
Spatial Resolution • Term spatial refers to the concept of space – in this case, two-dimensional image space • The term Spatial Resolution is used to describe how many pixels comprise a digital image • The more pixels, the greater its spatial resolution
Spatial frequency 1 • Every image contains details, some fine and some coarse • The details are made up of brightness transitions that cycle from dark to light and back to dark • The rate at which brightness cycle is the spatial frequency
Spatial frequency 2 • In the cloudy sky area, the image details vary smoothly, not like the area with the tree, thus consists low rates of brightness change, or low spatial frequency. • The area with the trees has minute details where the brightness vary rapidly, so the minute tree details constitute a high rate of brightness change, or high spatial frequency
Sampling Theorem • ”Thistheoremtells us mathematicallythat in order to representfully the spatialdetails of an orginalcontinuous-tone image, wemustsample the image at a rateat leasttwice as fast as the highestspatialfrequencycontained in it.” • To capture an image’sfinestdark-to-light-to-darkdetail, samplingshouldbe at leasttwosamplesupon the detail. • Whatever the samplingrateused, the highestspatialfrequencythatcanbecontained in the resultingdigital image willnotexceedone-half the samplingrate • Thisfrequency is referred to as the Nyquist rate. • If the rate is lessthantwice, SpatialAliasingwilloccur.
SamplingTheoremcontinued. • In real-life systems, the sampling rate of a particular image acquisition system is generally fixed • The camera is selected to meet the minimum spatial-resolution requirements of the application.
Images with different spatial resolutions 640 pixels x 480 lines 320 pixels x 240 lines 160 pixels x 120 lines 80 pixels x 60 lines 40 pixels x 30 lines 20 pixels x 15 lines
Spatial Aliasing • Spatial aliasing appears in a digital image when the details in an image are sampled at a rate less than twice their spatial frequency. • Not only are high-frequency details missed, but they are also corrupted to appear as new frequencies • When a detail within an image has a frequency greater than twice the sampling rate, the detail is called undersampled.
SpatialAliasing The high-frequency detail ends up being translated to a lower frequency because some of its brightness transitions are missed in the sampling process.
Group discussion • In which situations you have encountered spatial or temporal aliasing of images? • (temporal sampling means sampling in time domain, e.g. video frames)
Brightness Resolution • Brighness resolution tells us how accurately the digital pixel’s brightness represents the intensity of the orginal image • Dependent upon how many bits are used in the quantizer (3bits = 8 different colors, 111 =2^3=8) • The range of the gray scale is also referred to as dynamic range
Gray scales with differentamounts of bits 3-bit gray scale 4-bit gray scale 5-bit gray scale 6-bit gray scale 7-bit gray scale 8-bit gray scale
Brightness Histograms • Brightness histogram shows the different gray levels of pixels within a digital image • horizontal axis = ”brightness” from 0 to 255 • vertical axis = ”number of pixels” • with histogram it is easy to define whether an image is basically dark or light and high or low contrast
Contrast and Dynamic Range Indications • Contrast is a term that is often used to describe the brightness attributes of an image • Low contrast appears as tightly grouped mound of pixel brightness in the gray scale • High contrast appears as a bimodal histogram – two peaks exists at the outer brightness regions • The dynamic range is represented by how many gray levels in the gray scale are occupied
Low contrast and low dynamic range High contrast and high dynamic range Well-balanced contrast and low dynamic range
Color Histograms • Histograms for color images are threefold version of the regular, gray-level brightness histogram • Three histograms are computed and displayed, one for each color component • Can represent any color space (RGB, HSB, ...) • Each histogram can help us determine the brightness distributions, contrast, and dynamic ranges of the individual color components.