Download
1 / 9
90 likes | 248 Views
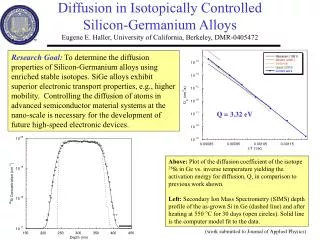
CdZnTe Substrate Photoluminescence in HgCdTe Arrays. A. Mainzer. CdZnTe Behavior with Proton Irradiation. Analyzed 31 files from Ames/Bernie Rauscher containing full-frame darks from H1RG w/ 5 m m detector material

E N D
CdZnTe Substrate Photoluminescencein HgCdTe Arrays A. Mainzer
CdZnTe Behavior with ProtonIrradiation • Analyzed 31 files from Ames/Bernie Rauscher containing full-frame darks from H1RG w/ 5 mm detector material • Data appear as 1024x1024x2 FITS cubes – a “signal” frame and a “noise” frame. • Signal frame = average of 5 frames • Noise frame = standard deviation of 5 frames • Each frame has 8 samples (Fowler 4?) • Easiest to spot CR strikes in noise frames, since hot/bad pixels don’t show up as much.
Two Examples Hits seem to disappear after each frame, although these are 5 frames averaged together, so it’s not possible to check this. Persistence effect unknown on a single-frame basis.
Amplitudes in Noise Frame • Median level in clean part of frame: ~0.0003 • Size of 5x noise region ~2400 pixels • Size of 17x noise region ~300 pixels • Regions assymetric due to CR propagation thru substrate @ oblique angle • Contours: • 0.001 • 0.0015 • 0.002 • 0.005 • 0.007 • 0.010
Another Hit • Median level in clean part of frame: 0.0003 • Size of 5x noise region ~510 pixels • Size of 17x noise region ~80 pixels • Regions asymmetric due to CR propagation thru substrate @ oblique angle • Contours: • 0.001 • 0.0015 • 0.002 • 0.005 • 0.007 • 0.01 • 0.05 • 0.1
A Simulated WISE Frame • Based on expected fluence of 1 hit/cm2/sec, we expect ~40 hits/frame. • This image simulates the appearance of a typical WISE frame w/o substrate removal YUCK
Scientific Impacts - Sensitivity • Based on an estimated 0.5 billion sources in the sky, we expect ~7000 point sources per WISE frame on average. Since most of sky is sparser, ~2400 is a reasonable. • I added ~2400 fake stars w/ FWHM ~3 pixels to the simulated image & ran a simple aperture photometry routine w/ inner radius = 4 & sky apertures = 7-15 pixels. • Measured in a clear (hit-free) region, the median SNR = 11. • Median of entire image (including hits) was SNR = 5, due to irregular background and increased noise caused by CRs. • 1/2400 sources was not detected due to inability of photometry routine to fit a Gaussian profile since source landed on CR • Although this is only a single WISE frame, not a stack of 8, this is a significant hit to sensitivity. Asteroid science will be particularly impacted. • Area affected is large enough that many sources will suffer from overlapping CR hits.
Scientific Impacts - Reliability • Production of significant numbers of false faint sources would negatively impact brown dwarf science, as many candidates will be single-band detections in band 2 can’t use cross-band identification schemes • An estimate of impact on reliability: • If ~2500 pixels are affected/CR, and we get ~30-50 CR/frame (based on 18 mm pixels and 1 CR/cm2/sec fluence), we can expect ~10% of all pixels are affected per frame • If we assume that a “source” must appear in 5/8 frames to be counted as a real detection, the probability of overlapping regions is 1e-5 • Multiply this by 1024x1024 pixels to get per pixel probability = 10 • Now assume that we require a source to cover ~10 pixels to appear as a point source 1 false source per set of 8 • We survey 40,000 sq deg / (47 arcmin2 FOV) = 65,000 looks at the same region • There will be ~60,000 false sources detected • VERY rough calculation – lacking details of precise source extraction algorithms