Download
1 / 32
320 likes | 435 Views
Productivity. Costs. and. Unit 3 – Theory of the Firm. Think about…. production. transformation of factors into goods & services. We are a firm. an economic institution that transforms factors of production into goods & services. A firm …. (1) organizes factors of production and/or.

E N D
Productivity Costs and Unit 3 – Theory of the Firm
Think about….production transformation of factors into goods & services We are a firm an economic institution that transforms factors of production into goods & services. A firm ….. (1) organizes factors of production and/or (2) produces goods, and/or (3) sells produced goods to individuals, gov’ts, businesses
Let’s say this student started his own business (firm)...... He puts together Leo Jams CD’s for his classmates by downloading music from He then burns a CD on his computer. Classmates are willing to pay $18.00 for a 10-song CD b/c Leonard puts together tunes better than....
Leo calculated the cost of producing each CD at $ 2.00 for equipment 9.00 for songs .80 labor .20 blank CD’s He sells each CD for $16.00 $16.00 per CD revenue = _________ per CD profit = __________ $4.00
Let’s say another student joined the market with her own mixes.... Now we have two suppliers in the market -- Leo Jams & Becca’s Boss Hits. What happens to the price of CD’s? Price falls to $11.50 per CD. 5 of 32
Should Leo burn the next CD at the new market price of $11.50? He’s already spent $ 2.00 for equipment He’d need to spend 9.00 for songs .80 labor .20 blank CD’s
Yes, he should burn that next CD. He should only be concerned with the costs in front of him. These are fixed costs = sunk costs $ 2.00 for equipment 9.00 for songs .80 labor .20 blank CD’s These are variable costs = the costs Leo should worry about
S U N K C O S T S Sunk costs – are fixed costs that are sunk, done, and over with. There is nothing you can do about them. They are irrelevant to your current decision-making process. **All Fixed Costs are Sunk Costs** It will cost Leo an additional _________ to burn the next CD & he will earn in revenue __________ for the next CD, therefore he should / should not burn it. $10.00 $11.50
In our book-producing firm…. What were our fixed costs? What were our variable costs?
Leo Jams CD’s take off. ¿….Decisions….decisions….?? How many workers do I hire? We examine productivity …. the amount of goods and services produced (output) per unit of productive resources used (input) in a specific period of time.
¿….Decisions….decisions….?? How many workers do I hire? Total CD’s burned Marginal Product No. of workers 10 1 10 12 2 22 How can marginal product decrease? 11 3 33 Explain how this is possible?? 3 4 36 5 32 -4
12 of 32 Law of …… Diminishing Marginal Productivity as more and more of a variable input is added to an existing fixed input, eventually the additional output one gets from that additional input is going to fall.
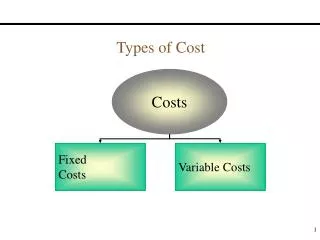
Q 0 10 11 12 13 14 15 16 17 18 19 20 FC 1,000 1,000 1,000 1,000 1,000 1,000 1,000 1,000 1,000 1,000 1,000 1,000 VC 0 1,085 1,215 1,365 1,540 1,780 2,105 2,530 3,065 3,720 4,500 5,430 TC 1,000 2,085 2,215 2,365 2,540 2,780 3,105 3,530 4,065 4,720 5,500 6,430 What are the definitions of each one of these costs? FC – Those costs that remain constant whether a firm produces 0 units to an infinite number of units. VC – Those costs that change (go up) when a firm produces from 1 unit to an infinite amount of units. TC = FC + VC
Q 0 10 11 12 13 14 15 16 17 18 19 20 FC 1,000 1,000 1,000 1,000 1,000 1,000 1,000 1,000 1,000 1,000 1,000 1,000 VC 0 1,085 1,215 1,365 1,540 1,780 2,105 2,530 3,065 3,720 4,500 5,430 TC 1,000 2,085 2,215 2,365 2,540 2,780 3,105 3,530 4,065 4,720 5,500 6,430 Let’s graph these columns to create our first, very own cost curves. TC (000) VC 6 5 4 3 2 FC 1 10 11 12 13 14 15 16 17 18 19 20
The total costs are important to firms, but more often under consideration are …. average costs average total cost = total cost divided by quantity produced ATC = TC/Q average fixed cost = fixed cost divided by quantity produced AFC = FC/Q average variable cost = variable cost divided by quantity produced AVC = VC/Q ATC = AFC + AVC
Q AFC Observe this row of data, what will usually be happening to AFC? 7 8 9 10 11 12 13 14 15 16 17 18 1,430 1,250 1,110 1,000 910 830 770 710 670 630 590 560 It will be decreasing because quantity will normally increase whereas fixed costs remain the same.
Q AFC AVC ATC Why do average variable costs rise? 7 8 9 10 11 12 13 14 15 16 17 18 1,430 1,250 1,110 1,000 910 830 770 710 670 630 590 560 2,710 2,490 2,240 2,090 2,010 1,970 1,950 1,990 2,070 2,221 2,390 2,620 1,290 1,240 1,130 1,090 1,100 1,140 1,180 1,270 1,400 1,580 1,800 2,070 Law of Diminishing Marginal Returns Why is ATC rising? Because AVC is getting bigger
6,000 5,000 4,000 3,000 2,000 1,000 Q AFC 18 of 32 5 6 7 8 9 10 11 12 13 14 15 16 17 18 2,000 1,670 1,430 1,250 1,110 1,000 910 830 770 710 670 630 590 560 AFC 5 6 7 8 9 10 11 12 13 14 15 16 17 18
6,000 5,000 4,000 3,000 2,000 1,000 Q AVC The lowest point on the AVC curve is at quantity 10. 5 6 7 8 9 10 11 12 13 14 15 16 17 18 1,380 1,330 1,290 1,240 1,130 1,090 1,100 1,140 1,180 1,270 1,400 1,580 1,800 2,070 AVC AFC 5 6 7 8 9 10 11 12 13 14 15 16 17 18
6,000 5,000 4,000 3,000 2,000 1,000 Q ATC The lowest point on the ATC curve is at quantity 13. 5 6 7 8 9 10 11 12 13 14 15 16 17 18 3,380 3,000 2,710 2,490 2,240 2,090 2,010 1,970 1.950 1,990 2,070 2.221 2.390 2,620 ATC AVC AFC 5 6 7 8 9 10 11 12 13 14 15 16 17 18
6,000 5,000 4,000 3,000 2,000 1,000 A few important points: ATC AVC 1. The ATC curve looks like a smiley face. ATC 2. The AVC curve looks like a smirk. AVC AFC 5 6 7 8 9 10 11 12 13 14 15 16 17 18
6,000 5,000 4,000 3,000 2,000 1,000 If we got rid of the AFC curve, could you figure out what the AFC are without the curve? ATC AVC ATC AVC AFC 5 6 7 8 9 10 11 12 13 14 15 16 17 18
6,000 5,000 4,000 3,000 2,000 1,000 From now on, we will NOT be drawing too many AFC curves because.... AFC = ATC - AVC ATC AVC 23 of 32 5 6 7 8 9 10 11 12 13 14 15 16 17 18
In economics we say firms and individuals…. make decisions on the margin We saw this when we studied demand and marginal utility analysis. When choosing between and a consumer will choose ice cream until… MU of hamburger/P hamburger = MU of ice cream / P ice cream
Q AFC AVC ATC MC So…marginal cost is important to firm. 7 8 9 10 11 12 13 14 15 16 17 18 1,430 1,250 1,110 1,000 910 830 770 710 670 630 590 560 2,710 2,490 2,240 2,090 2,010 1,970 1.950 1,990 2070 2.221 2.390 2620 1,000 900 300 650 1,300 1,500 1,750 2,400 3,250 4,250 5,350 6,550 1,290 1,240 1,130 1,090 1,100 1,140 1,180 1,270 1,400 1,580 1,800 2,070 The firm is concerned with the cost of the next unit, just as the consumer is concerned with the …
Q MC 6,000 5,000 4,000 3,000 2,000 1,000 MC 5 6 7 8 9 10 11 12 13 14 15 16 17 18 1,200 1,100 1,000 900 300 650 1,300 1,500 1,750 2,400 3,250 4,250 5,350 6,550 ATC AVC 5 6 7 8 9 10 11 12 13 14 15 16 17 18
A few important points: 6,000 5,000 4,000 3,000 2,000 1,000 MC MC 1. The MC curve looks like the Nike Swoosh ATC 2. MC touches AVC and ATC at their lowest points. AVC 5 6 7 8 9 10 11 12 13 14 15 16 17 18
6,000 5,000 4,000 3,000 2,000 1,000 MC Law of diminishing marginal returns-- Diminishing Marginal Returns sets in here As more and more of a variable input are added to a fixed input, the additional output begins to go down. ATC Explain why AVC 28 of 32 5 6 7 8 9 10 11 12 13 14 15 16 17 18
Review: In firm cost analysis cost What’s on the y axis? 5,000 4,000 3,000 2,000 1,000 What’s on the x axis? quantity 5 6 7 8 9 10 11 12 13 14
Review: In firm cost analysis cost 5,000 4,000 3,000 2,000 1,000 What’s the shape of the ATC curve? ATC AVC What’s the shape of the AVC curve? quantity 5 6 7 8 9 10 11 12 13 14
Review: In firm cost analysis MC cost 5,000 4,000 3,000 2,000 1,000 ATC What’s the shape of the MC curve? AVC quantity 5 6 7 8 9 10 11 12 13 14
6,000 5,000 4,000 3,000 2,000 1,000 MC Where does the MC curve have to intersect the ATC & AVC curves? ATC AVC 32 of 32 5 6 7 8 9 10 11 12 13 14 15 16 17 18