Download
1 / 12
120 likes | 128 Views
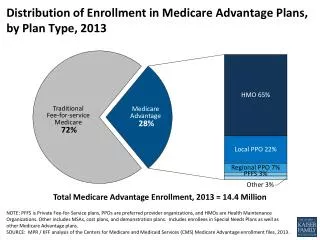
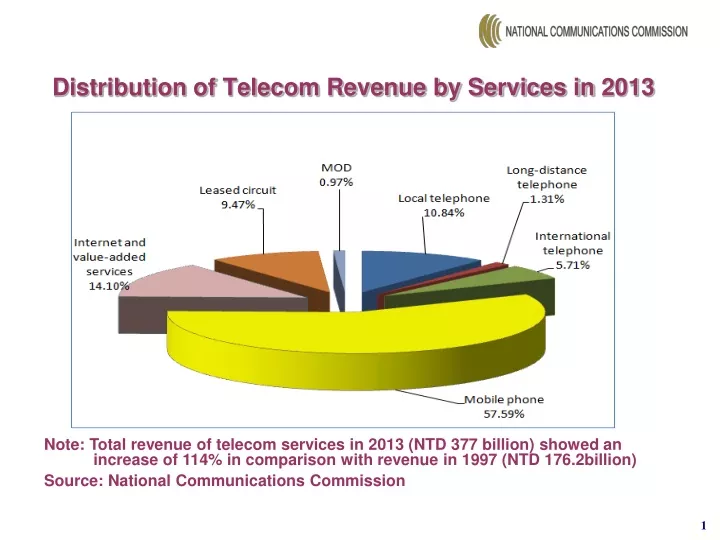
Distribution of Telecom Revenue by Services in 2013. Note: Total revenue of telecom services in 2013 (NTD 377 billion) showed an increase of 114% in comparison with revenue in 1997 (NTD 176.2billion) Source: National Communications Commission.

E N D
Distribution of Telecom Revenue by Services in 2013 Note:Total revenue of telecom services in 2013 (NTD 377 billion) showed an increase of 114% in comparison with revenue in 1997 (NTD 176.2billion) Source: National Communications Commission
Mobile Market - Proportion of Prepaid Card Subscribers (unit:%) Source: National Communications Commission
Evolution of Mobile Market (unit: Millions of subs) Note: The first 3G operator launched its service in July 2003 - four other operators began in 2005 (between July and Dec.) Source: National Communications Commission
Number of Telecom Subscribers by Services Notes: 1. “Internet users” refers to individuals who accessed the internet during the year (figures are released by III-FIND) 2. “Fixed Broadband subscribers” refers to subscribers of ADSL, FTTx, Cable Modem, Leased Line , PWLAN 3. “Mobile Broadband subscribers” refers to subscribers of 3G who can access the internet, WBA Source: National Communications Commission
Telecom Services Subscribers per 100 inhabitants Notes: 1. “Internet users” refers to individuals who accessed the internet during the year (figures are released by III-FIND) 2. “Fixed Broadband subscribers” refers to subscribers of ADSL, FTTx, Cable Modem, Leased Line , PWLAN 3. “Mobile Broadband subscribers” refers to subscribers of 3G who can access the internet, WBA Source: National Communications Commission
Analysis of Fixed Broadband Subscribers-by Technologies Note: “others” include the subscribers of PWLAN, Leased Line. Source: National Communications Commission
Internet access via 3G mobile networks Note: The figures are for December of the stated year. Source: National Communications Commission
Mobile voice volume has overtaken fixed since 2007 (fiscal year) (in billion of minutes) Note: Fixed Communications include the voice volume of local network, long-distance network, and international network Source: National Communications Commission
Average Revenue Per User (ARPU) of Mobile Services (NTD per month) Notes: 1. ARPU of mobile phone refers to total amount of mobile phone revenue per month divided by the number of mobile phone subscribers 2. Figures cover only the data of mobile operators who provide both 2G and 3G services Source: National Communications Commission
Mobile Data Service Revenue - as proportion of Total Mobile Revenue Note: Mobile data service revenue includes revenue of WAP, GPRS, SMS and other data communication services Source: National Communications Commission
Data Communication Revenue as proportion of Total Telecom Revenue Note: The items of data communication revenue include revenue of mobile data service, internet service, value-added services and leased circuit service Source: National Communications Commission
SMS(Short Message Service)Volume and Revenue Source: National Communications Commission