Download
1 / 31
360 likes | 921 Views
5 ) Soil Classification. Prepared From The Coduto’s Text Book by Instr. Nurullah AKBULUT. Chinese legends record a classification of soils according to color and structure which was made by the engineer Yu during the reign of Emperor Yao, about 4000 years ago.

E N D
5) Soil Classification Prepared From The Coduto’s Text Book by Instr. Nurullah AKBULUT Chinese legends record a classification of soils according to color and structure which was made by the engineer Yu during the reign of Emperor Yao, about 4000 years ago. This is the earliest known soil classification system (Thorp, 1936)
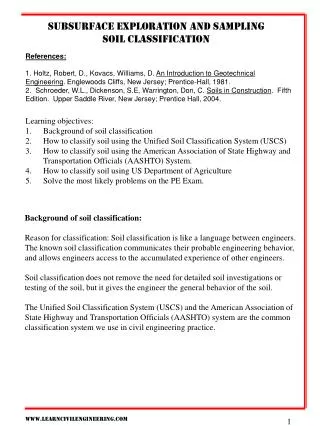
Classification systems have been developed, usually based on the grain-size distribution and the Atterberg limits. They often are supplemented by non-standardized classifications of other properties, such as consistency and cementation.
UNIFIED SOIL CLASSIFICATION SYSTEM (USCS) • Arthur Casagrande developed a new engineering soil classification system for the United States Army during World War II (Casagrande, 1948). Since then, it has been updated and is now standardized in ASTM D2487 as • The Unified Soil Classification System (USCS). • Unlike the other systems, the USCS is not limited to any particular kind of project; it is an all-purpose system and has become the most common soil classification system among geotechnical engineers. • In its original form, the classification consisted only of a two- or four-letter group symbol. Later, the system was MODIFIED by the addition of several group names for each group symbol.
For example, a typical USCS classification would be: • SM — Silty sand with gravel • where "SM" is the group symbol and "Silty sand with gravel" is the group name. • The position of a soil type in the group name indicates it relative importance, as follows: • Noun = Primary component • Adjective = Secondary component (or further explanation of primary component) • "with ..." = Tertiary component • For example, a clayey sand with gravel has sand as the most important component, clay as the second most important, and gravel as the third most important. If very little of a soil type is present, then it is not included in the group name at all. For example, a clayey sand is similar to the soil just described, except it has less than 15 percent gravel.
Initial Classification To use the Unified Soil Classification System, begin with an initial classification as follows: 1) Determine if the soil is highly organic: Such soils: have organic material, dark browndark gray, or black color, Organic odorespecially when wet, and soft consistency, have fibrous material (remnants of stems, leaves, roots, etc) If the soil does not have these characteristics (and the vast majority do not), then go to Step 2. However, if it does, then classify it as follows: Group symbolPt Group namePeat This completes the unified classification for highly organic soils. These soils are very problematic because of their high compressibility and low strength, so the group symbol Pt on a boring log is a red flag to geotechnical engineers. 2)Conduct a sieve analysis to determine the grain-size distribution curve. For aninformal classification, a grain-size distribution curve based on a visual inspectionmay suffice.
3)Based on the grain-size distribution curve, determine the percent by weight passingthe 3-inch, #4, and #200 sieves, then compute the percentage by weight of gravel,sand, and fines using the definitions in ASTM Particle Size Classification 4) If 100 % of the sample passes the 3-inch sieve, go to Step 5. If not, base the classification on the part that passes this sieve (usually called the "minus 3-inch fraction"). To do so, adjust the percentages of gravel, sand, and fines using a procedure similar to that in Example 5.1. Then, perform the classification based on these modified percentages, and note the percentage of cobbles and/or boulders and the maximum particle size with the final classification. For example, if 20 percent of the soil is cobbles, some as large as 8 inches, the USCS classification (after going through the rest of the procedure) might be: SW - Well-graded sand with gravel and 20% cobbles, max 8 inches 5)If 5 %or more of the soil passes the #200 sieve, then conduct Atterberg limitstests to determine the liquid and plastic limits. 6)If the soil is fine-grained (i.e., 50 % passes the #200 sieve), follow thedirections for fine-grained soils. If the soil is coarse-grained (i.e., < 50 percent passesthe #200 sieve), follow the directions for coarse-grained soils.
SOILS 1) FINE GRAINED 2) COARSE GRAINED
Classification of Fine-Grained Soils • Fine-grained soils are those that have at least 50 % passing the #200 sieve. Thus, these soils are primarily silt and/or clay. • Casagrande developed the plasticity chart in for the classification of Fine-grained soils. This chart uses the Atterberg limits to distinguish between clays and silts. • Although most fine-grained soils contain both clay and silt, and possibly sand and gravel as well, those that plot above the A-line are classified as clays, while those below this line are silts.
Figure 5.3 Plasticity chart (ASTM D2487). The "A-line" separates silts from clays, while the "U-line" represents the upper limit of recorded test results. Data that plot above the U-line are probably in error. Note how the vertical axis is the plasticity index, not the plastic limit. Soils identified as "non-plastic" (NP) are classified as ML
We use the plasticity chart to determine the group symbol for fine-grained soils. It usually consists of two letters, which are interpreted as follows: First Letter MPredominantly silt - C Predominantly clay-OOrganic SecondLetter L Low plasticity - HHigh plasticity CL soils are known as lean clays, while CH soils are fat clays. The corresponding terms for ML and MH soils are silt and elastic silt,respectively, even though the stress-strain behavior of MH soils is no more elastic than any other soil.
ORGANIC SOILS If the liquid limit after oven drying is less than 75 percent of the original value, then the soil is considered to be organic. If not, then it is inorganic.
Example • The natural soils along a proposed highway alignment have a grain-size distribution as described by curve A in Figure 5.2, a liquid limit of 44, and a plastic limit of 21. Classify the inorganic soil using Unified Classification System?
Solution Initial classification 100% passes 3-inch sieve, so no adjustments are necessary 50% passes #200 sieve, so the soil is fine-grained Classification of fine-grained soil Soil is inorganic, so use Figure 5.4 Liquid limit = 44. Plastic limit =21. Plasticity Index=23 Liquid limit < 50, Above A Line, PI=23 therefore, Plots as CL (Lean Clay) For Modified Classification: <70% passes #200 % sand = #4-#200 = 97% - 54% = 43% % gravel = 3-in-#4 = 100% - 97% = 3% % sand > % gravel < 15% gravel Group name = Sandy lean clay Final result: CL —Sandy lean clay Answer
Classification of Coarse-Grained Soils • Coarse-grained soils are those that have less than 50 percent passing the #200 sieve. Thus these soils are primarily sand and/or gravel. The group symbols for coarse-grained soils are: First Letter S: Predominantly sand– G: Predominantly gravel Second Letter P: Poorly graded – W: Well graded M: Silty – C: Clayey
Poorly graded soils are those with a narrow range of particle sizes (i.e., a steep grain-size distribution curve) • Well-graded soils have a wide range of particle sizes (i.e.. a flatter grain-size distribution curve). • In this context, silty (M) or clayey (C) indicate a large percentage of silt or clay in a coarse-grained soil.
To classify coarse-grained soils, use the flow chart in Figure 5.6. By inspection of this chart, we see that both sands and gravels are divided into three categories depending on the percentage of fines (fines = percent passing the #200 sieve): If < 5 percent fines: Use two-letter group symbol to describegradation. (well orpoorly graded) (GW, GP, SW, SP) If 5 - 12 percent fines: Use four-letter group symbol todescribe both gradation andtype of fines. (GW-GM, GW-GC, GP-GM, GP-GC, SW-SM, SW-SC, SP-SM, SP-SC) If > 12 percent fines: Use two-letter group symbol to describe type of fines (silt orclay) (GM, GC, GC-GM, SM, SC, SC-SM)
ExampleThe inorganic soil C in Figure 5.2 has a liquid limit of 30 and a plastic limit of 25. Determine its unified soil classification. Figure 5.2Grain-size distribution curves.
Solution Initial classification 100% passes 3-in sieve, so no adjustments are necessary < 50% passes #200 sieve, so soil is coarse-grained Classification of coarse-grained soils % gravel = 3-in-#4 = 100% - 100% = 0% % sand = #4-#200 = 100% - 4% = 96% % fines = #200 = 4% D10=0.10mm D30= 0.17 mm D60= 0.40 mm CU=0.40/0.10=4.0 CC=(D30)2/(D10D60)=0.72 Using Figure 5.6 % sand > % gravel < 5% fines Cu < 6 and Cc < 1, so group symbol is SP < 15% gravel Final results: SP — Poorly-graded sand Answer
ExampleThe inorganic soil C in Figure 5.2 has a liquid limit of 30 and a plastic limit of 25. Determine its unified soil classification. Figure 5.2Grain-size distribution curves.
Solution Initial classification 100% passes 3-in sieve, so no adjustments are necessary < 50% passes #200 sieve, so soil is coarse-grained Classification of coarse-grained soils % gravel = 3-in-#4 = 100% - 80% = 20% % sand = #4-#200 = 80% - 10% = 70% % fines = #200= 10% D10=0.075 mm D30 = 0.39 mm D60= 1.7 mm CU=D60/ D10= 23 Cc = 1.2 Using Figure 5.6 % sand > % gravel 5-12% fines Cu > 6 and 1<=Cc<= 3 (therefore soil is well graded) IP= 30 - 25 = 5 Fines plot as ML on Figure 5.3, so group symbol is SW-SM (Well-graded sand with silt) Modified Classification: >15% gravel Final result: SW-SM — Well-graded sand with silt and gravelAnswer
Classification of Borderline Soils • Sometimes a soil classification is very close to the dividing line between two different group symbols. In such cases, it is acceptable to use both symbols in the classification, with the "correct" symbol first, followed by the "almost correct" symbol. • For example, a sand-clay combination with slightly less than 50 percent fines could be identified as SC/CL.
Soil Assessment Based on USCS Classification • Geotechnical engineers have many ways to assess the suitability of a soil for particular purposes. • For example, if a soil is being considered for use as an "impervious" cap over a sanitary landfill, we would perform hydraulic conductivity tests to determine how easily water flows through it. Soils that restrict the flow of water are best for landfill caps. However, before we perform these specialized tests, geotechnical engineers assess a soil based on its classification. • For example, a SW soil would pass water very easily, and thus would be rejected for the landfill cap even without a hydraulic conductivity test. • Table 5.2 presents general soil properties based on the unified group symbol, and may be used to assist in such assessments.
VISUAL-MANUAL SOIL CLASSIFICATION Although geotechnical engineers routinely perform sieve, hydrometer, and Atterberg limits tests, it is not cost-effective to do so on every sample obtained from the field, so the remaining samples must be classified without the benefit of laboratory test data. The following methods can assist in this process: • The #200 sieve approximately corresponds to the smallest particles one can see with the unaided eye. Thus, individual fine sand particles can be distinguished, but individual silt particles cannot. In addition, particles larger than the #200 sieve have a gritty texture, while those smaller are pastey. • Clay and silt particles often clump together, and may look like sand. These clumpswill dissolve when wetted. Therefore, when in doubt, be sure to wet the soil beforeclassifying it. • Clays (CL and CH) have a higher dry strength, but lose this strength when wetted.In addition, moist clays can be rolled between the fingers into 5-mm diameter threads. • Silts (ML and MH) have a lower dry strength, and are much more difficult to roll into threads. • Cementing agents, such as calcium carbonate, are sometimes present in sandy or silty soils. These agents can give the soil a high dry strength, even if no clay is present. Again, the key is to wet the sample before classifying it. Cemented soils will retain their dry strength, while clayey soils will soften when wetted.
APPLICABILITY AND LIMITATIONS Standardized soil classification systems are very valuable tools that help geotechnical engineers identify soils and make preliminary assessments of their engineering behavior.However they also have limitations. Casagrande (1948) said: “It is not possible to classify all soils into a relatively small number of groups such that the relation of each soil to the many divergentproblems of applied soil mechanics will be adequately presented.” • Therefore, do not expect too much from a soil classification system. Identifying the proper classification is a good start, but we still need to use other test results, an understanding of soil behavior, engineering judgment, and experience.
SUMMARY 1) Standardized soil classification systems are an important part of the language ofgeotechnical engineering. They help us identify soils and communicate importantcharacteristics to other engineers. In addition, a classification helps us developpreliminary assessments of a soil's behavior. 2) The Unified Soil Classification System is an all-purpose system based on grain size and Atterberg limits data. 3) Supplemental soil classifications assist in further describing important characteristicsnot addressed by classification systems.