Download
1 / 16
160 likes | 288 Views
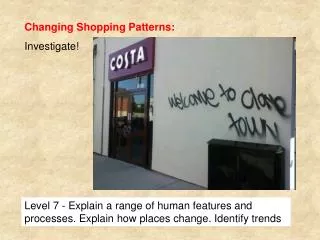
Changing Residentail Patterns 1991 - 2001. Dan Vickers, Department of Geography, University of Sheffield. UPTAP Conference 21 -23 March 2007. Changing Residential Patterns 1991 - 2001. Background.

E N D
Changing Residentail Patterns 1991 - 2001 Dan Vickers, Department of Geography, University of Sheffield UPTAP Conference 21 -23 March 2007
Changing Residential Patterns 1991 - 2001 Background • Project scheduled to run 1st January 2006 – 31st December 2006, in the School of Geography, University of Leeds. • PhD handed in Friday 13th January 2006. • Viva started a year ago to this minute across the corridor. • 1st September 2006 Appointed ‘Lecturer in Social and Spatial Inequalities’ in the Department of Geography, University of Sheffield. • Therefore only able to complete 8 out of the scheduled 12 months of the project. • Rearranged schedule to complete the research one day a week, to be completed by the 1st September 2007.
Changing Residential Patterns 1991 - 2001 Research • Original idea: To attempt to examine the change in residential patterns over time using geodemographic techniques. • Why So? • My PhD created the national classification of output areas for the ONS http://www.statistics.gov.uk/about/methodology_by_theme/area_classification/default.asp • The classification show distinct and clear residential patens. • Click for map: http://www.casa.ucl.ac.uk/googlemaps/OAC-super-EngScotWales.html
Changing Residential Patterns 1991 - 2001 Research • Variable selection. • Can the variables be compared across time? • Can the whole UK be used? • Matching the geography. • Methodology. • Two years separately or all together. • Transformation? • Standardisation. • Method of Clustering. • How many clusters? • Results so far
Changing Residential Patterns 1991 - 2001 Research • Variable Selection • Social Class a/b • Social Class c1 • Social Class d • Social Class e • Non White
Changing Residential Patterns 1991 - 2001 Research • Matching the Geography • 1991 data assigned to 2001 geography using population weighted centriods.
Changing Residential Patterns 1991 - 2001 Research • Methodology • Data ranked then standardised between 0 -1. • K-means clustering used. • Both years clustered together. • Looking at between 2 – 7 clusters.
Changing Residential Patterns 1991 - 2001 Research 2001 • Results so far 1991 In the same group: 99,927 (60.3%) In different group: 65,738 (39.7%) Cluster 1: -7,675 Cluster 2: -12,964 Cluster 3: +20,639
Changing Residential Patterns 1991 - 2001 Research North East 2001 Cluster 1: -421 (-31%) Cluster 2: -1,517 (-38%) Cluster 3: +1,938 (+59%) 1991 North West 2001 Cluster 1: -1,481 (-27%) Cluster 2: -2,439 (-26%) Cluster 3: +3,920 (+51%) 1991 Yorkshire & the Humber 2001 Cluster 1: -814 (-23%) Cluster 2: -1,966 (-27%) Cluster 3: +2,780 (+46%) 1991
Changing Residential Patterns 1991 - 2001 Research East Midlands 2001 Cluster 1: -705 (-20%) Cluster 2: -1,378 (-24%) Cluster 3: +2,083 (+44%) 1991 West Midlands 2001 Cluster 1: -1,534 (-28%) Cluster 2: -1,310 (-23%) Cluster 3: +2,639 (+41%) 1991 East 2001 Cluster 1: -905 (-13%) Cluster 2: -1,058 (-16%) Cluster 3: +1,963 (+42%) 1991
Changing Residential Patterns 1991 - 2001 Research London 2001 Cluster 1: -2,186 (-12%) Cluster 2: -118 (-28%) Cluster 3: +2,304 (+43%) 1991 South East 2001 Cluster 1: +401 (+4%) Cluster 2: -1,783 (-18%) Cluster 3: +1,382 (+23%) 1991 South West 2001 Cluster 1: -30 (-1%) Cluster 2: -1,395 (-15%) Cluster 3: +1,425 (+34%) 1991
Changing Residential Patterns 1991 - 2001 Research 2001 1991
Changing Residential Patterns 1991 - 2001 Research 1991 2001
Changing Residential Patterns 1991 - 2001 Outputs • Papers • Vickers, D.W. and Rees, P.H. (2007). Creating the National Statistics 2001 Output Area Classification. Journal of the Royal Statistical Society, Series A 170(2). • Vickers, D.W. and Rees, P.H. (2006). Introducing the National Classification of Census Output Areas, Population Trends, 125. • Conferences and Meetings • June 2006, 3rd International Population Geography Conf, Liverpool. • August 2006, Regional Science, Jersey. • 2nd November 2006 Exploring the use and value of the ONS output area classification, seminar at the RSS in London. • Tomorrow, Geodemographics workshop, ICOSS University of Sheffield. • 2nd April 2007 repeat of the RSS seminar by popular demand. • April 2007 AAG San Francisco.
Changing Residential Patterns 1991 - 2001 Outputs • Other activities • The formation of a Classification user group as part of the RSS • Website will hopefully be formally lunched on 2nd April • Other meetings and events to follow • http://areaclassification.group.shef.ac.uk/