Download
1 / 16
160 likes | 239 Views
12 Weeks to TAKS- Week One:. Objective 1 1a, 2a-d, 3a,b. Safety, Accurate measurement, Experimental set-up/ Scientific Method, Reading Graphs/ Making Calculations, Consumer issues/ Scientific Information.

E N D
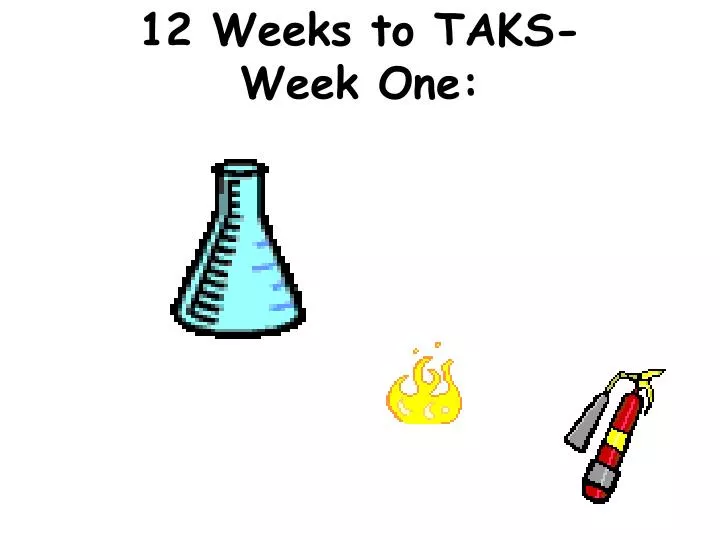
12 Weeks to TAKS- Week One:
Objective 1 1a, 2a-d, 3a,b Safety, Accurate measurement, Experimental set-up/ Scientific Method, Reading Graphs/ Making Calculations, Consumer issues/ Scientific Information
These are some of the easiest questions on the tests. You have to get 31 questions out of 55 to pass this test. Seventeen of them will be Objective 1 questions. Data shows that students who answer at least 10 of these 17 correctly usually pass. Don’t miss the easy ones!
SAFETY: Review your safety rules before you go in to the test. You should have received a copy at the beginning of the school year. You can also find these in you textbook. Pour acid into water, tie your hair back, know how to read an MSDS sheet, don’t pour unknown chemicals down the sink, or return them to unlabeled containers, etc. You know how it goes.
Safety Terms: Caustic or corrosive- Will corrode or eat away metal, skin, or other substances. Volatile- Evaporates quickly, may form dangerous vapors. Flammable (may ignite)- will catch on fire or explode easily. Ventilation- removing contaminated air and brining in fresh air.
Accurate measurement When measuring distance: You will have a ruler on the side of your formula sheet. USE IT if you are asked to measure distance on a map or a length. You must measure accurately and precisely. The wrong answer choices will test to see if you do. Use Metrics!!!
When measuring liquids: Wear goggles! Use a graduated cylinder or graduated pipette. Beakers are not accurate!!! Read the bottom of the meniscus (curved line formed by the water) on a graduated cylinder or burette. Check your units. Do they increase or decrease? Do they go up by 1.0, 0.1, or 5.0? Read carefully.
When massing solids: Wear goggles! Use a weigh boat or paper. Subtract out the weight of the container or paper to zero the balance. Clean up spills. Volume of irregular objects: Use a graduated cylinder to take volume by water displacement .
Experimental set-up/Scientific Method: When scientists begin an experiment they use the steps of the Scientific Method. You will be asked to do many of these steps on the test. The Problem (in the form of a question) that the scientists will try to answer, must be logical and based on data or observations. A prediction called a Hypothesisis next. It must be a testable statement that you could gather data to prove. (You can’t measure which is the “prettiest”, “strongest”, or “best”.)
You must control an experiment. You can test only one variable at a time. (How does the amount of water effect plant growth? Keep the light, containers, soil and plants the same.) Controls are kept the same in all trials. A Control Group is the set-up that isn’t changed. (One plant gets the normal amount of water!). The independent variable is the thing you change (amount of water). The dependent variable is the result of the change you made(height of plant in cm.). Controls: Light, type of plant, amount of soil, pot, temperature.
Independent variable: Amount of water given in mm. Dependent variable: Plant growth in cm.
The Conclusion must be supported by the data and results you gather. To be valid, each experiment needs a large sample size (grow 2000 plants in each experiment) and must be repeated many times in order to prove the Hypothesis (grow 2000 plants 100 times). If you are collecting samples, in an experiment, do it randomly. Don’t take them all from one place. Yes! No!
Reading Graphs and Making Calculations Some TAKS questions ask students to analyze graphs or do basic math calculations to solve problems or draw conclusions. The Independent Variable on a graph is on the X-axis. The Dependent variable is on the Y-axis.
Line graphs represent change over time. The steeper the slope of a line, the faster the change in time is occurring. Pie graphs represent %’s of a whole.
Pictographs use symbols to represent numbers. Always check keys and legends to accurately read units and labels on graphs. Bar graphs represent numbers of individuals or items in each category.
You may be asked to calculate a %. To find a %, dividethe # of items you have by the total #, then multiply by 100. Carefully read product labels and claims. Make sure you can separate fact from opinion.