Download
1 / 38
380 likes | 615 Views
22 nd Lecture – November 17, 2011 -- Assignment 3 is posted. This will be due Tues. Nov. 29th. -- Read Kneitel and Miller for after T-day. -- Note that you are running out of talks!. Dr. Iliana B. Baums Pennsylvania State University, University Park

E N D
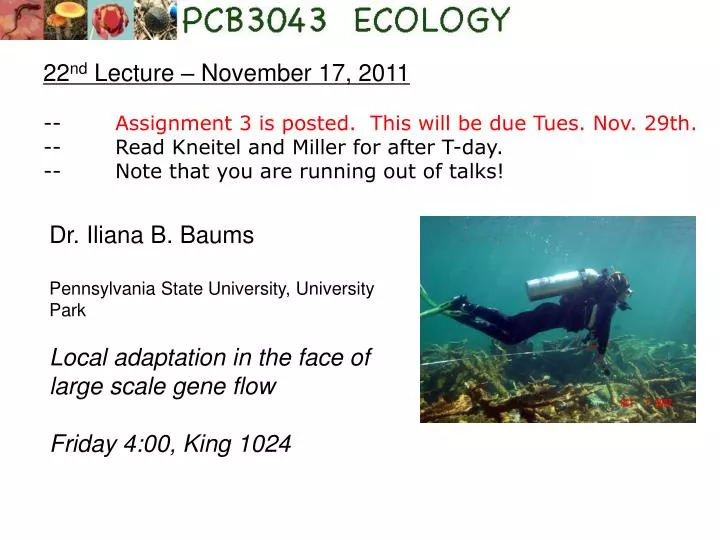
22nd Lecture – November 17, 2011 -- Assignment 3 is posted. This will be due Tues. Nov. 29th. -- Read Kneitel and Miller for after T-day. -- Note that you are running out of talks! Dr. Iliana B. Baums Pennsylvania State University, University Park Local adaptation in the face of large scale gene flow Friday 4:00, King 1024
V. Community ecology A. What is community ecology? 1. What is a community - "An assemblage of populations of living organisms in a prescribed area or habitat that interact with one another, directly or indirectly” Similar terms: ecosystem: all the interacting parts of the physical and biological worlds. association: group of species living in the same place. guild: species in the same community utilizing resources in the same way, often competitors.
V. Community ecology A. What is community ecology? 1. What is a community - "An assemblage of populations of living organisms in a prescribed area or habitat that interact with one another, directly or indirectly” A caution that ecologists use “community” to mean two different things: -- as described above, all the species in an area or -- what might more properly be called a guild, which is all the species that share a resource base (e.g., birds, rodents, or plants)
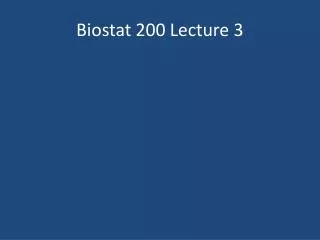
V. Community ecology A. What is community ecology? 1. What is a community? 2. Approaches to studying communities a. Descriptions - associations between different species and between different species assemblages and climate. Biomes, Holdridge classification, now GIS. Phytosociology - the study of the composition and structure of plant communities. b. Population-based approaches - reductionist view, using individuals and species as building blocks and units. Stresses biotic interactions such as predation and competition. c. Ecosystem ecology - also can be reductionist, using energy and nutrients as units instead of individuals and populations.
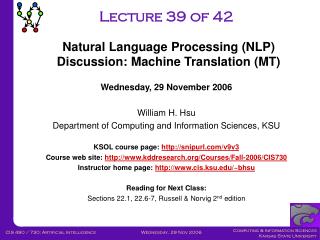
Example of Phytosociology Some Floristic provinces of NA: I. Tundra II. Northern conifer III. Eastern deciduous IV. Coastal Plains V. West Indian VI. Grassland VII. Cordilleran Forest VIII. Great Basin IX. California X. Sonoran
V. Community ecology A. What is community ecology? 1. What is a community? 2. Approaches to studying communities a. Descriptions - associations between different species and between different species assemblages and climate. Biomes, Holdridge classification, now GIS. b. Population-based approaches - reductionist view, using individuals and species as building blocks and units. Stresses biotic interactions such as predation and competition. c. Ecosystem ecology - also can be reductionist, using energy and nutrients as units instead of individuals and populations.
V. Community ecology A. What is community ecology? 1. What is a community? 2. Approaches to studying communities a. Descriptions - associations between different species and between different species assemblages and climate. Biomes, Holdridge classification, now GIS. b. Population-based approaches - reductionist view, using individuals and species as building blocks and units. Stresses biotic interactions such as predation and competition. c. Ecosystem ecology - also can be reductionist, using energy and nutrients as units instead of individuals and populations.
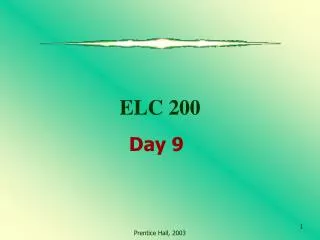
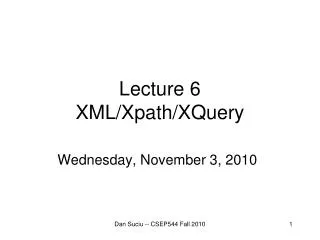
c. Ecosystem ecology - also can be reductionist, using energy and nutrients as units instead of individuals and populations. Odum’s model of the Silver Springs ecosystem
IV. Community ecology A. What is community ecology? B. How do we quantify communities?
IV. Community ecology A. What is community ecology? B. How do we quantify communities? 1. Tools of community ecology a. growth form and structure b. number of species vs. diversity of species c. dominance/ relative abundance: d. rank abundance curves e. food or trophic webs
IV. Community ecology A. What is community ecology? B. How do we quantify communities? 1. Tools of community ecology a. growth form and structure prairie vs. forests, coral reef vs. sandy bottom b. number of species vs. diversity of species c. dominance/ relative abundance: d. rank abundance curves e. food or trophic webs
S = 13 spp. IV. Community ecology A. What is community ecology? B. How do we quantify communities? 1. Tools of community ecology a. growth form and structure b. number of species vs. diversity of species c. dominance/ relative abundance d. rank abundance curves e. food or trophic webs S = 12 spp.
IV. Community ecology . . . a. growth form and structure (sedans, trucks, etc.) b. number of species vs. diversity of species (10 vs. 9 species) Here is a list of car colors from FSU lots, which we can treat like “communities” and compare. Since students and faculty have a very similar number of species, are they really similar communities?
V. Community ecology . . . a. growth form and structure (sedans, trucks, etc.) b. species number, diversity, or eveness Shannon-Weiner diversity index:
V. Community ecology . . . a. growth form and structure (sedans, trucks, etc.) b. species number, diversity, or eveness Shannon-Weiner diversity index: FACULTY = 2.10 STUDENT = 1.94
V. Community ecology . . . a. growth form and structure (sedans, trucks, etc.) b. species number, diversity, or eveness Shannon-Weiner diversity index: FACULTY = 2.10 STUDENT = 1.94 Indices are handy, but confound species number with eveness of abundance.
b. number of species (S) and diversity of species (H’) • Both can also be measured at different spatial scales: • -- alpha diversity is within-habitat diversity, number of species in local, small areas of uniform habitat • -- beta diversity is between habitat diversity, the variation in species composition from one habitat to another within a region. This is really a measure of variation in diversity, not diversity directly. • -- gamma diversity is regional diversity, number of species in a larger area of interest across habitats or local areas
Consider three different regional communities, each with five different local populations and maximum of five species:
Consider three different regional communities, each with five different local populations and maximum of five species:
Consider three different regional communities, each with five different local populations and maximum of five species:
Consider three different regional communities, each with five different local populations and maximum of five species: It may be helpful to think of the relationship between these measures as alpha * beta = gamma though this is not totally accurate.
IV. Community ecology . . . a. growth form and structure (sedans, trucks, etc.) b. diversity or species number (10 vs. 9) c. dominance/ relative abundance (blue/grey vs. red/black) d. rank abundance curves.
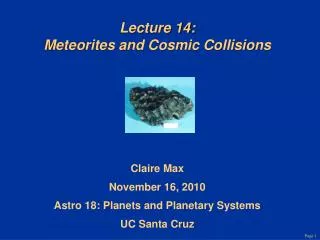
Rank abundance curves have been measured for lots of communities and seem to fall into several different sorts of shapes. Why? What do these curves tell us about communities?
Rank-abundance curves for faculty/staff car, based on abundance
Rank-abundance curves for faculty/staff car, based on proportion
Rank-abundance curves for faculty/staff car, based on log (proportion)
faculty/staff students
IV. Community ecology . . . a. growth form and structure (sedans, trucks, etc.) b. diversity or species number (10 vs. 9) c. dominance/ relative abundance (blue/grey vs. red/black) d. rank abundance curves. Now, back to our list of car colors. Another way to describe these communities be based on the dominant species (in red). Even better would be to somehow describe the rankings of species in each community. We can do that with a graph.
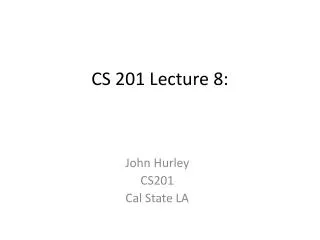
-- geometric assumes division of resource in regular, sequential way. -- broken stick model assumes division of a single resource, but random. -- log-normal distribution also. In this case, it is likely that multiple factors are affecting the distribution of species abundances (such as competing for multiple resources). Most communities fit a log-normal distribution.
--- Faculty --- Students
Study Guide Items from Lecture 22 • Terms: • Community • alpha diversity • Ecosystem • beta diversity • Association • gamma diversity • Guild • Phytosociology • Diversity • Richness • Concepts: • 3 approaches to studying communities • Different ways to describe a community • Species diversity includes richness plus the eveness of relative abundance. • Shannon-Weiner index of diversity • Alpha, beta, and gamma diversity – different spatial scales • Rank-abundance curves • The meaning of shapes of the rank-abundance curves (e.g., broken stick model) • Case Studies: • Hubbell’s graph of tree diversity in different forests