Download
1 / 10
110 likes | 225 Views
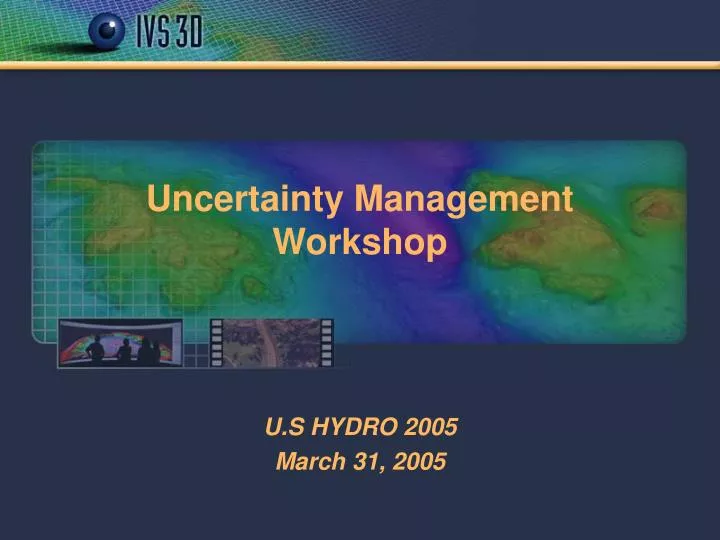
Uncertainty Management Workshop. U.S HYDRO 2005 March 31, 2005. Summary. Presentation and demonstration TPE attribution Processing – QC/QA Available tools. Roll. Heave. Pitch. Yaw. θ v. Beamwidth. Range Sampling. Tx/Rx. GPS. VRU. Total Propagated Errors (TPE).

E N D
Uncertainty Management Workshop U.S HYDRO 2005 March 31, 2005
Summary Presentation and demonstration • TPE attribution • Processing – QC/QA • Available tools
Roll Heave Pitch Yaw θv Beamwidth Range Sampling Tx/Rx GPS VRU Total Propagated Errors (TPE) Each sounding attributed with vertical and horizontal errors, based on propagating sensor uncertainties through error model
TPE calculation • Available in some files (GSF, HIPS, SURF, HTF, ASCII) • Calculated in error model - requires suitable parameters • “Simple” model
Processing - QC Interactive 3D Visualization Area Based Spatial Access Statistical Surface Estimation A separation of work flow tasks into: • Interactive Processing Time • Minimize time requiring operator attention • Non-Interactive Time • Maximize Computing/Hardware Tasks
Fledermaus - CUBE • Processing - QC/QA • Hybrid approach • Filter and surface • Simple loader • Output options • Clean soundings, attributed surface
Crosscheck Tool • Point vs. surface analysis • Input: • Reference surface • Survey lines to analyze • Output: • Difference analysis statistics • IHO statistics • Histogram for detailed analysis