Download

1 / 19
190 likes | 406 Views
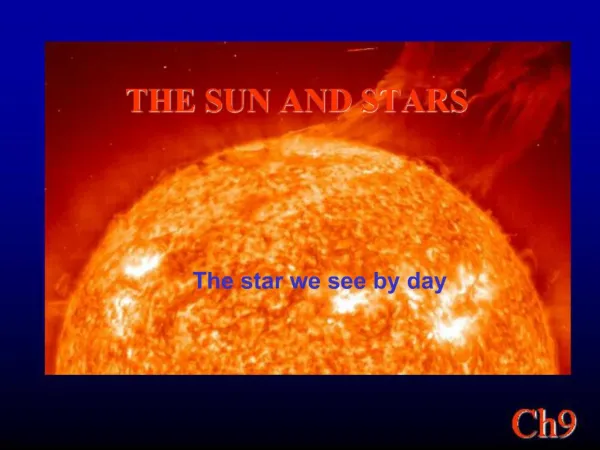
The Sun and the Stars. The Sun and the Stars. The Sun and the Stars. The Sun and the Stars. Classification of stellar spectra Potted History :

E N D
The Sun and the Stars The Sun and the Stars
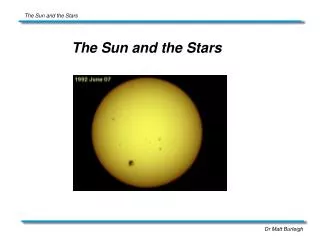
The Sun and the Stars Classification of stellar spectra Potted History : 1802 William Wallaston – showed that the spectrum of the sun is not simply a continuous spectrum, but is broken up by a series of dark lines (absorption lines). 1814 Joseph Fraunhofer identified ~600 lines in the solar spectrum and measured wavelengths for approx half. that number. Lines now known as Fraunhofer lines. 1863 Angelo Secchi – crude spectral typing 1864 William Huygens matched some of the Fraunhofer lines to absorption lines seen in the spectra of other stars. 1890s Edward Pickering (Harvard College Observatory) starts project to obtain spectra of all stars observed down to 8th magnitude Subsequently shown that : small number of distinct patterns of absorption lines seen in stellar spectra Spectral classification
The Sun and the Stars Spectral Classification – Harvard Classification scheme Work originally started by Henry Draper, continued by Annie Jump Cannon in 1910s, results published in the Henry Draper Catalogue. Extended version of HD catalogue contains spectra of 225,000 stars down to 9th magnitude. Annie Jump Cannon – spectra are dominated by lines of Hydrogen and Helium and small amounts of metals. Original scheme had classes OBAFGKM (now extended to L, T and Y dwarfs) Most important lines are Balmer series of H, neutral and singly ionised He, Fe, Ca H and K doublet, the G band (CH molecule), neutral Ca, metal lines and Ti O. excitation-ionisation sequence Scheme is based on (i) absence of lines (ii) line strengths (W()) (iii) line ratios
The Sun and the Stars The Hertzsprung-Russell Diagram (E. Hertzsprung and H.N. Russell) Plot of surface temperature versus luminosity, or colour (e.g. B-V) versus absolute magnitude M, and various other combinations bright Can distinguish between early type and late-type stars dim Hot Cool
The Sun and the Stars HCS is a temperature classification scheme – why? Once a star has formed, there is little mixing of the core and surface material, and few chemical reactions spectral differences reflect primarily differences in the surface temperature O 50,000 K strong He+ lines, no H lines B 20,000 K strong neutral He lines, v. weak H lines A 10,000 K Strongest H lines, weak Ca+ emerge F 7,500 K H grows weaker,Ca+ becomes stronger, metals G 6,000 K Strong Ca+,Fe+ and other metals , H weaker K 4,000 K Strong metal lines, weak CH,CN bands emerge M 3,500 K strong TiO and VO emerge and strengthen Cannon - further subdivided classes from 0 to 9 (0 hotter, 9 cooler), so that F5, lies halfway between F0 and G0. In this scheme the Sun is classed as G2
The Sun and the Stars Harvard classification scheme
The Sun and the Stars Examples spectral classification sequences
The Sun and the Stars 1943 Yerkes SCS(or MKK – named after Morgan, Keenan and Kellman) Extends Harvard classification by using line shapes to estimate surface gravities MKK luminosity classification Ia luminous Supergiants Ib less luminous Supergiants II luminous Giants III normal Giants IV sub Giants V main sequence stars (dwarfs) VI sub Dwarfs In this extended scheme the sun is classified as G2V
dwarf stars : smaller radii higher surface gravity c.f. giants • therefore higher surface density and higher surface pressure – under higher pressure atoms collide more frequently, collisions shorten lifetime of excited state. smaller Δt, larger ΔE (ΔE Δt ≈ h/2π) => lines are broader! also at a given temperature, T, atoms are thermalised more easily at lower pressure
The Sun and the Stars MKK luminosity classification
The Sun and the Stars Additional classes Wolf Rayet, W or WR – mostly He atmos. - dying supergiants with fast stellar winds subtypes WC, WN or WO (for Carbon, Nitrogen and Oxygen) (Possible GRB/Hypernovae progenitors) Carbon stars, C (originally R and N classification), red-giants/supergiants near end of lives with excess, Carbon in atmosphere WDs, D – stars are no longer undergoing thermonuclear reactions, simply cooling subclasses designated A,B,O,Q,Z,C,X depending on optical lines present (ie atmospheric composition) L stars,T,Y dwarfs – Cool stars, T and Y dwarfs are not massive enough to undergo nuclear fusion (Brown dwarfs)
The Sun and the Stars Since spectral type is essentially a temperature sequence, we can construct a colour-magnitude diagram, a diagram of Absolute magnitude Mv versus colour, e.g. Hyades open cluster Colour magnitude diagrams can be used to estimate distances – spectroscopic parallax
The Sun and the Stars Spectroscopic parallax • From a stars spectrum, we can identify • Spectral type (or colour) • Luminosity class These fix a position on the HR diagram from which we can measure Mv Since, , theobserved apparent magnitude mgives us the distance modulus, and hence the distance to the star
The Sun and the Stars Colour-colour diagrams NB a colour is just a flux ratio If stars radiated like blackbodies then a colour-colour plot would be unique and follow a straight line BB The kink in the “lazy S” Is due to the Balmer discontinuity (BD at 3640 falls into U-band) U-B B-V
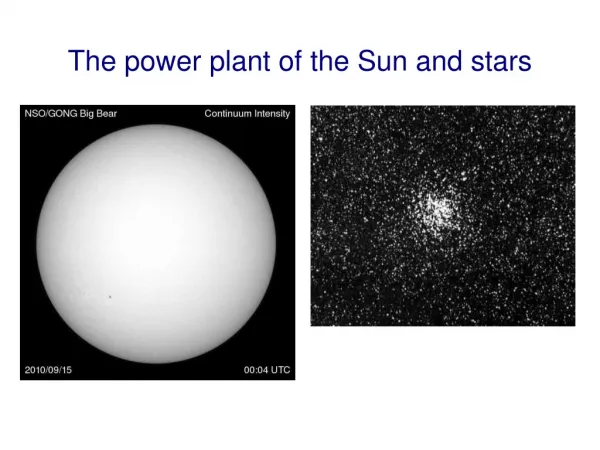
The Sun and the Stars When we looks at young clusters and globular clusters their colour-magnitude diagrams appear very different Globular clusters consist of ~half a million stars gravitationally bound, and located above the plane of the galaxy. They are old metal poor stars. Show extensive red-giant,AGB and horizontal branch As well as main sequence Young open clusters are metal rich pop 1 stars. Dominated by their main sequence stars, they are young so very few stars have evolved off of the main sequence. Age can be determined from the location of the turn-off point, younger clusters will turn off at higher luminosities
The Sun and the Stars Globular cluster schematic colour-magnitude diagram