Download
1 / 63
630 likes | 763 Views
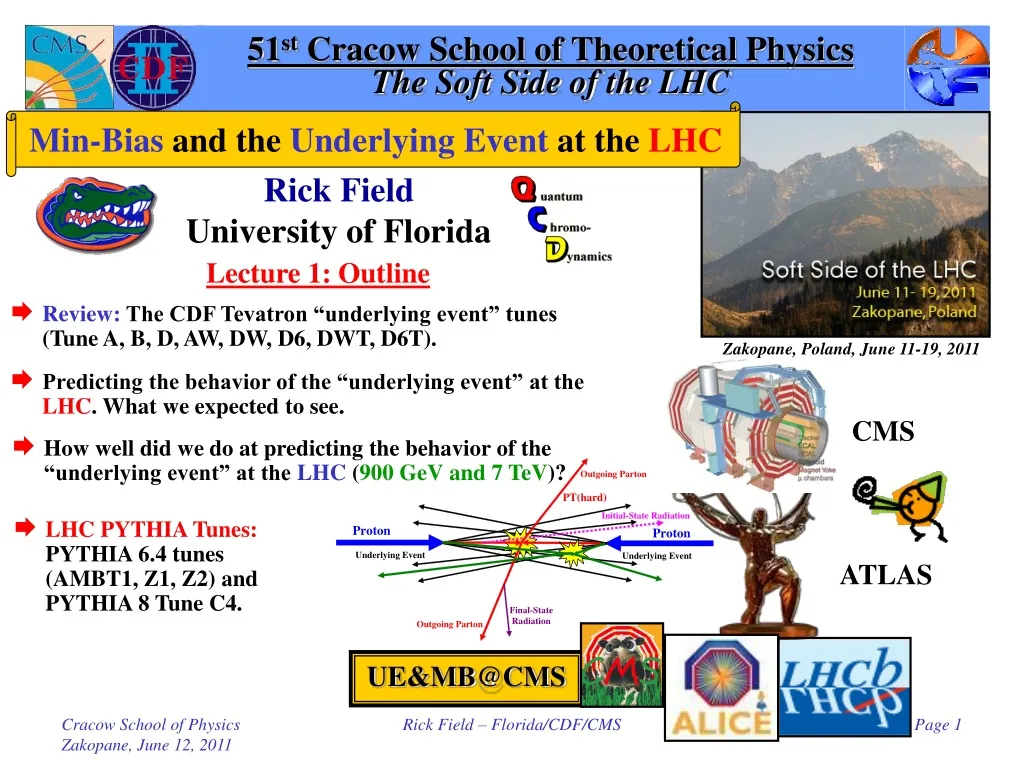
51 st Cracow School of Theoretical Physics The Soft Side of the LHC. Min-Bias and the Underlying Event at the LHC. Rick Field University of Florida. Lecture 1: Outline. Review: The CDF Tevatron “underlying event” tunes (Tune A, B, D, AW, DW, D6, DWT, D6T).

E N D
51st Cracow School of Theoretical PhysicsThe Soft Side of the LHC Min-Bias and the Underlying Event at the LHC Rick Field University of Florida Lecture 1: Outline • Review: The CDF Tevatron “underlying event” tunes (Tune A, B, D, AW, DW, D6, DWT, D6T). Zakopane, Poland, June 11-19, 2011 • Predicting the behavior of the “underlying event” at the LHC. What we expected to see. CMS • How well did we do at predicting the behavior of the “underlying event” at the LHC (900 GeV and 7 TeV)? • LHC PYTHIA Tunes:PYTHIA 6.4 tunes (AMBT1, Z1, Z2) and PYTHIA 8 Tune C4. ATLAS UE&MB@CMS Rick Field – Florida/CDF/CMS
51st Cracow School of Theoretical PhysicsThe Soft Side of the LHC Min-Bias and the Underlying Event at the LHC Rick Field University of Florida Lecture 2: Tomorrow • How are “min-bias” collisions related to the “underlying event”. Zakopane, Poland, June 11-19, 2011 • How well did we do at predicting the behavior of “min-bias” collisions at the LHC (900 GeV and 7 TeV)? CMS • Baryon and Strange Particle Production at the LHC: Fragmentation tuning. ATLAS UE&MB@CMS Rick Field – Florida/CDF/CMS
Toward an Understanding ofHadron-Hadron Collisions From Feynman-Field to the LHC Rick Field University of Florida Lecture 3: Tuesday Evening Feynman • Before Feynman-Field Phenomenology: The Berkeley years. • The early days of Feynman-Field Phenomenology. • From 7 GeV/c p0’s to 1 TeV Jets! Field Rick Field – Florida/CDF/CMS
“Hard Scattering” Component QCD Monte-Carlo Models:High Transverse Momentum Jets • Start with the perturbative 2-to-2 (or sometimes 2-to-3) parton-parton scattering and add initial and final-state gluon radiation (in the leading log approximation or modified leading log approximation). “Underlying Event” • The “underlying event” consists of the “beam-beam remnants” and from particles arising from soft or semi-soft multiple parton interactions (MPI). The “underlying event” is an unavoidable background to most collider observables and having good understand of it leads to more precise collider measurements! • Of course the outgoing colored partons fragment into hadron “jet” and inevitably “underlying event” observables receive contributions from initial and final-state radiation. Rick Field – Florida/CDF/CMS
Proton Proton Proton Proton MPI, Pile-Up, and Overlap MPI: Multiple Parton Interactions • MPI: Additional 2-to-2 parton-parton scatterings within a single hadron-hadron collision. Pile-Up Interaction Region Dz • Pile-Up: More than one hadron-hadron collision in the beam crossing. Overlap • Overlap: An experimental timing issue where a hadron-hadron collision from the next beam crossing gets included in the hadron-hadron collision from the current beam crossing because the next crossing happened before the event could be read out. Rick Field – Florida/CDF/CMS
Traditional Approach CDF Run 1 Analysis • Look at charged particle correlations in the azimuthal angle Df relative to a leading object (i.e. CaloJet#1, ChgJet#1, PTmax, Z-boson). For CDF PTmin = 0.5 GeV/c hcut = 1. Charged Particle Df Correlations PT > PTmin |h| < hcut Leading Calorimeter Jet or Leading Charged Particle Jet or Leading Charged Particle or Z-Boson “Transverse” region very sensitive to the “underlying event”! • Define |Df| < 60o as “Toward”, 60o < |Df| < 120o as “Transverse”, and |Df| > 120o as “Away”. • All three regions have the same area in h-f space, Dh×Df = 2hcut×120o = 2hcut×2p/3. Construct densities by dividing by the area in h-f space. Rick Field – Florida/CDF/CMS
ISAJET 7.32 (without MPI)“Transverse” Density ISAJET uses a naïve leading-log parton shower-model which does not agree with the data! • Plot shows average “transverse” charge particle density (|h|<1, pT>0.5 GeV) versus PT(charged jet#1) compared to the QCD hard scattering predictions of ISAJET 7.32 (default parameters with PT(hard)>3 GeV/c) . • The predictions of ISAJET are divided into two categories: charged particles that arise from the break-up of the beam and target (beam-beam remnants); and charged particles that arise from the outgoing jet plus initial and final-state radiation(hard scattering component). ISAJET “Hard” Component February 25, 2000 Beam-Beam Remnants Rick Field – Florida/CDF/CMS
HERWIG 6.4 (without MPI)“Transverse” Density • Plot shows average “transverse” charge particle density (|h|<1, pT>0.5 GeV) versus PT(charged jet#1) compared to the QCD hard scattering predictions of HERWIG 5.9(default parameters with PT(hard)>3 GeV/c without MPI). • The predictions of HERWIG are divided into two categories: charged particles that arise from the break-up of the beam and target (beam-beam remnants); and charged particles that arise from the outgoing jet plus initial and final-state radiation(hard scattering component). HERWIG uses a modified leading-log parton shower-model which does agrees better with the data! HERWIG “Hard” Component Beam-Beam Remnants Rick Field – Florida/CDF/CMS
Tuning PYTHIA 6.2:Multiple Parton Interaction Parameters Hard Core Determines the energy dependence of the MPI! Determine by comparing with 630 GeV data! Affects the amount of initial-state radiation! Take E0 = 1.8 TeV Reference point at 1.8 TeV Rick Field – Florida/CDF/CMS
PYTHIA 6.206 Defaults MPI constant probability scattering • Plot shows the “Transverse” charged particle density versus PT(chgjet#1) compared to the QCD hard scattering predictions of PYTHIA 6.206 (PT(hard) > 0) using the default parameters for multiple parton interactions and CTEQ3L, CTEQ4L, and CTEQ5L. PYTHIA default parameters Default parameters give very poor description of the “underlying event”! Note Change PARP(67) = 4.0 (< 6.138) PARP(67) = 1.0 (> 6.138) Rick Field – Florida/CDF/CMS
Run 1 PYTHIA Tune A CDF Default Feburary 25, 2000! • Plot shows the “transverse” charged particle density versus PT(chgjet#1) compared to the QCD hard scattering predictions of two tuned versions of PYTHIA 6.206 (CTEQ5L, Set B (PARP(67)=1)andSet A(PARP(67)=4)). PYTHIA 6.206 CTEQ5L Run 1 Analysis Old PYTHIA default (more initial-state radiation) Old PYTHIA default (more initial-state radiation) New PYTHIA default (less initial-state radiation) New PYTHIA default (less initial-state radiation) Rick Field – Florida/CDF/CMS
“Transverse” Conesvs “Transverse” Regions • Sum the PT of charged particles in two cones of radius 0.7 at the same h as the leading jet but with |DF| = 90o. • Plot the cone with the maximum and minimum PTsum versus the ET of the leading (calorimeter) jet. “Cone Analysis” (Tano, Kovacs, Huston, Bhatti) Transverse Cone: p(0.7)2=0.49p Transverse Region: 2p/3=0.67p Rick Field – Florida/CDF/CMS
Energy Dependenceof the “Underlying Event” “Cone Analysis” (Tano, Kovacs, Huston, Bhatti) • Sum the PT of charged particles (pT > 0.4 GeV/c) in two cones of radius 0.7 at the same h as the leading jet but with |DF| = 90o. Plot the cone with the maximum and minimum PTsum versus the ET of the leading (calorimeter) jet. • Note that PYTHIA 6.115 is tuned at 630 GeV with PT0 = 1.4 GeV and at 1,800 GeV with PT0 = 2.0 GeV. This implies that e = PARP(90) should be around 0.30 instead of the 0.16 (default). • For the MIN cone 0.25 GeV/c in radius R = 0.7 implies a PTsum density of dPTsum/dhdf = 0.16 GeV/c and 1.4 GeV/c in the MAX cone implies dPTsum/dhdf = 0.91 GeV/c (average PTsum density of 0.54 GeV/c per unit h-f). 630 GeV 1,800 GeV PYTHIA 6.115 PT0 = 1.4 GeV PYTHIA 6.115 PT0 = 2.0 GeV Rick Field – Florida/CDF/CMS
“Transverse” Charged DensitiesEnergy Dependence Increasing e produces less energy dependence for the UE resulting in less UE activity at the LHC! Lowering PT0 at 630 GeV (i.e. increasing e) increases UE activity resulting in less energy dependence. • Shows the “transverse” charged PTsum density (|h|<1, PT>0.4 GeV) versus PT(charged jet#1) at 630 GeV predicted by HERWIG 6.4 (PT(hard) > 3 GeV/c, CTEQ5L) and a tuned version of PYTHIA 6.206 (PT(hard) > 0, CTEQ5L, Set A, e = 0, e = 0.16 (default) and e = 0.25 (preferred)). • Also shown are the PTsum densities (0.16 GeV/c and 0.54 GeV/c) determined from the Tano, Kovacs, Huston, and Bhatti “transverse” cone analysis at 630 GeV. Rick Field Fermilab MC Workshop October 4, 2002! Reference point E0 = 1.8 TeV Rick Field – Florida/CDF/CMS
CDF Run 1 PT(Z) PYTHIA 6.2 CTEQ5L • Shows the Run 1 Z-boson pT distribution (<pT(Z)> ≈ 11.5 GeV/c) compared with PYTHIA Tune A (<pT(Z)> = 9.7 GeV/c), Tune A25 (<pT(Z)> = 10.1 GeV/c), and Tune A50 (<pT(Z)> = 11.2 GeV/c). UE Parameters ISR Parameter Vary the intrensic KT! Intrensic KT Rick Field – Florida/CDF/CMS
CDF Run 1 PT(Z) Tune used by the CDF-EWK group! PYTHIA 6.2 CTEQ5L • Shows the Run 1 Z-boson pT distribution (<pT(Z)> ≈ 11.5 GeV/c) compared with PYTHIA Tune A (<pT(Z)> = 9.7 GeV/c), and PYTHIA Tune AW (<pT(Z)> = 11.7 GeV/c). UE Parameters ISR Parameters Effective Q cut-off, below which space-like showers are not evolved. Intrensic KT The Q2 = kT2 in as for space-like showers is scaled by PARP(64)! Rick Field – Florida/CDF/CMS
Df Jet#1-Jet#2 Jet#1-Jet#2 Df Distribution Jet-Jet Correlations (DØ) • MidPoint Cone Algorithm (R = 0.7, fmerge = 0.5) • L= 150 pb-1 (Phys. Rev. Lett. 94 221801 (2005)) • Data/NLO agreement good. Data/HERWIG agreement good. • Data/PYTHIA agreement good provided PARP(67) = 1.0→4.0 (i.e. like Tune A, best fit 2.5). Rick Field – Florida/CDF/CMS
CDF Run 1 PT(Z) PYTHIA 6.2 CTEQ5L • Shows the Run 1 Z-boson pT distribution (<pT(Z)> ≈ 11.5 GeV/c) compared with PYTHIA Tune DW, and HERWIG. UE Parameters ISR Parameters Tune DW uses D0’s perfered value of PARP(67)! Intrensic KT Tune DW has a lower value of PARP(67) and slightly more MPI! Rick Field – Florida/CDF/CMS
PYTHIA 6.2 Tunes All use LO as with L = 192 MeV! UE Parameters Uses CTEQ6L Tune A energy dependence! ISR Parameter Intrinsic KT Rick Field – Florida/CDF/CMS
PYTHIA 6.2 Tunes All use LO as with L = 192 MeV! UE Parameters Tune B Tune AW Tune BW Tune A ATLAS energy dependence! ISR Parameter Tune DW Tune D6 Tune D Tune D6T Intrinsic KT Rick Field – Florida/CDF/CMS
Min-Bias “Associated”Charged Particle Density 35% more at RHIC means 26% less at the LHC! • Shows the “associated” charged particle density in the “transverse” regions as a function of PTmax for charged particles (pT > 0.5 GeV/c, |h| < 1, not including PTmax) for “min-bias” events at 0.2 TeV and 14 TeVfrom PYTHIA Tune DW and Tune DWT at the particle level (i.e. generator level). The STAR data from RHIC favors Tune DW! ~1.35 ~1.35 0.2 TeV → 14 TeV (~factor of 70 increase) RHIC LHC Rick Field – Florida/CDF/CMS
Min-Bias “Associated”Charged Particle Density • Shows the “associated” charged particle density in the “transverse” region as a function of PTmax for charged particles (pT > 0.5 GeV/c, |h| < 1, not including PTmax) for “min-bias” events at 0.2 TeV, 1.96 TeV and 14 TeVpredicted by PYTHIA Tune DW at the particle level (i.e. generator level). ~1.9 ~2.7 0.2 TeV → 1.96 TeV (UE increase ~2.7 times) 1.96 TeV → 14 TeV (UE increase ~1.9 times) RHIC LHC Tevatron Rick Field – Florida/CDF/CMS
The “Underlying Event” at STAR • At STAR they have measured the “underlying event at W = 200 GeV (|h| < 1, pT > 0.2 GeV) and compared their uncorrected data with PYTHIA Tune A + STAR-SIM. Rick Field – Florida/CDF/CMS
Transverse Charged Particle Density If the LHC data are not in the range shown here then we learn new (QCD) physics! Rick Field October 13, 2009 RDF LHC Prediction! • Shows the “associated” charged particle density in the “transverse” region as a function of PTmax for charged particles (pT > 0.5 GeV/c, |h| < 1, not including PTmax) for “min-bias” events at 1.96 TeVfrom PYTHIATune A, Tune S320, Tune N324, and Tune P329 at the particle level (i.e. generator level). Tevatron LHC • Extrapolations of PYTHIA Tune A, Tune DW, Tune DWT, Tune S320, Tune P329, and pyATLAS to the LHC. Rick Field – Florida/CDF/CMS
“Transverse” Charged Density • Shows the charged particle density in the “transverse” region for charged particles (pT > 0.5 GeV/c, |h| < 1) at 7 TeVas defined by PTmax, PT(chgjet#1), and PT(muon-pair) from PYTHIATune DWat the particle level (i.e. generator level). Charged particle jets are constructed using the Anti-KT algorithm with d = 0.5. Rick Field – Florida/CDF/CMS
Min-Bias “Associated”Charged Particle Density • Shows the “associated” charged particle density in the “transverse” region as a function of PTmax for charged particles (pT > 0.5 GeV/c, |h| < 1, not including PTmax) for “min-bias” events at 0.2 TeV, 0.9 TeV, 1.96 TeV, 7 TeV, 10 TeV, 14 TeVpredicted by PYTHIA Tune DW at the particle level (i.e. generator level). LHC14 LHC10 LHC7 Tevatron 900 GeV RHIC 0.2 TeV → 1.96 TeV (UE increase ~2.7 times) 1.96 TeV → 14 TeV (UE increase ~1.9 times) RHIC LHC Tevatron Linear scale! Rick Field – Florida/CDF/CMS
Min-Bias “Associated”Charged Particle Density • Shows the “associated” charged particle density in the “transverse” region as a function of PTmax for charged particles (pT > 0.5 GeV/c, |h| < 1, not including PTmax) for “min-bias” events at 0.2 TeV, 0.9 TeV, 1.96 TeV, 7 TeV, 10 TeV, 14 TeVpredicted by PYTHIA Tune DW at the particle level (i.e. generator level). LHC14 LHC10 LHC7 Tevatron 900 GeV RHIC 7 TeV → 14 TeV (UE increase ~20%) LHC7 LHC14 Linear on a log plot! Log scale! Rick Field – Florida/CDF/CMS
Conclusions November 2009 • We are making good progress in understanding and modeling the “underlying event”. RHIC data at 200 GeV are very important! • The new Pythia pT ordered tunes (py64 S320 and py64 P329) are very similar to Tune A, Tune AW, and Tune DW. At present the new tunes do not fit the data better than Tune AW and Tune DW. However, the new tune are theoretically preferred! • It is clear now that the default value PARP(90) = 0.16 is not correct and the value should be closer to the Tune A value of 0.25. • The new and old PYTHIA tunes are beginning to converge and I believe we are finally in a position to make some legitimate predictions at the LHC! • All tunes with the default value PARP(90) = 0.16 are wrong and are overestimating the activity of min-bias and the underlying event at the LHC! This includes all my “T” tunes and the (old) ATLAS tunes! UE&MB@CMS • Need to measure “Min-Bias” and the “underlying event” at the LHC as soon as possible to see if there is new QCD physics to be learned! Rick Field – Florida/CDF/CMS
“Transverse” Charged Particle Density • Fake data (from MC) at 900 GeV on the “transverse” charged particle density, dN/dhdf, as defined by the leading charged particle (PTmax) and the leading charged particle jet (chgjet#1) for charged particles with pT > 0.5 GeV/c and |h| < 2. The fake data (from PYTHIA Tune DW) are generated at the particle level (i.e. generator level) assuming 0.5 M min-bias events at 900 GeV (361,595 events in the plot). Leading Charged Particle Jet, chgjet#1. Prediction! Leading Charged Particle, PTmax. Rick Field MB&UE@CMS Workshop CERN, November 6, 2009 Rick Field – Florida/CDF/CMS
“Transverse” Charge Density Rick Field MB&UE@CMS Workshop CERN, November 6, 2009 factor of 2! Prediction! 900 GeV → 7 TeV (UE increase ~ factor of 2) LHC 900 GeV LHC 7 TeV ~0.4 → ~0.8 • Shows the charged particle density in the “transverse” region for charged particles (pT > 0.5 GeV/c, |h| < 2) at 900 GeV and 7 TeVas defined by PTmax from PYTHIATune DW andat the particle level (i.e. generator level). Rick Field – Florida/CDF/CMS
“Transverse” Charged Particle Density • Fake data (from MC) at 900 GeV on the “transverse” charged particle density, dN/dhdf, as defined by the leading charged particle (PTmax) and the leading charged particle jet (chgjet#1) for charged particles with pT > 0.5 GeV/c and |h| < 2. The fake data (from PYTHIA Tune DW) are generated at the particle level (i.e. generator level) assuming 0.5 M min-bias events at 900 GeV (361,595 events in the plot). Monte-Carlo! Real Data! • CMS preliminary data at 900 GeV on the “transverse” charged particle density, dN/dhdf, as defined by the leading charged particle (PTmax) and the leading charged particle jet (chgjet#1) for charged particles with pT > 0.5 GeV/c and |h| < 2. The data are uncorrected and compared with PYTHIA Tune DW after detector simulation (216,215 events in the plot). Rick Field – Florida/CDF/CMS
“Transverse” Charged PTsum Density Monte-Carlo! Real Data! • Fake data (from MC) at 900 GeV on the “transverse” charged PTsum density, dPT/dhdf, as defined by the leading charged particle (PTmax) and the leading charged particle jet (chgjet#1) for charged particles with pT > 0.5 GeV/c and |h| < 2. The fake data (from PYTHIA Tune DW) are generated at the particle level (i.e. generator level) assuming 0.5 M min-bias events at 900 GeV (361,595 events in the plot). • CMS preliminary data at 900 GeV on the “transverse” charged PTsum density, dPT/dhdf, as defined by the leading charged particle (PTmax) and the leading charged particle jet (chgjet#1) for charged particles with pT > 0.5 GeV/c and |h| < 2. The data are uncorrected and compared with PYTHIA Tune DW after detector simulation (216,215 events in the plot). Rick Field – Florida/CDF/CMS
PYTHIA Tune DW CMS ATLAS • ATLAS preliminary data at 900 GeV and 7 TeV on the “transverse” charged particle density, dN/dhdf, as defined by the leading charged particle (PTmax) for charged particles with pT > 0.5 GeV/c and |h| < 2.5. The data are corrected and compared with PYTHIA Tune DW at the generator level. • CMS preliminary data at 900 GeV and 7 TeV on the “transverse” charged particle density, dN/dhdf, as defined by the leading charged particle jet (chgjet#1) for charged particles with pT > 0.5 GeV/c and |h| < 2. The data are uncorrected and compared with PYTHIA Tune DW after detector simulation. Rick Field – Florida/CDF/CMS
PYTHIA Tune DW Ratio CMS CMS • Ratio of CMS preliminary data at 900 GeV and 7 TeV on the “transverse” charged particle density, dN/dhdf, as defined by the leading charged particle jet (chgjet#1) for charged particles with pT > 0.5 GeV/c and |h| < 2. The data are uncorrected and compared with PYTHIA Tune DW after detector simulation. • CMS preliminary data at 900 GeV and 7 TeV on the “transverse” charged particle density, dN/dhdf, as defined by the leading charged particle jet (chgjet#1) for charged particles with pT > 0.5 GeV/c and |h| < 2. The data are uncorrected and compared with PYTHIA Tune DW after detector simulation. Rick Field – Florida/CDF/CMS
PYTHIA Tune DW CMS ATLAS • Ratio of CMS preliminary data at 900 GeV and 7 TeV on the “transverse” charged particle density, dN/dhdf, as defined by the leading charged particle jet (chgjet#1) for charged particles with pT > 0.5 GeV/c and |h| < 2. The data are uncorrected and compared with PYTHIA Tune DW after detector simulation. • Ratio of the ATLAS preliminary data at 900 GeV and 7 TeV on the “transverse” charged particle density, dN/dhdf, as defined by the leading charged particle (PTmax) for charged particles with pT > 0.5 GeV/c and |h| < 2.5. The data are corrected and compared with PYTHIA Tune DW at the generator level. Rick Field – Florida/CDF/CMS
PYTHIA Tune DW How well did we do at predicting the “underlying event” at 900 GeV and 7 TeV? Tune DW Tune DW • I am surprised that the Tunes did not do a better job of predicting the behavior of the “underlying event” at 900 GeV and 7 TeV! Tune DW Rick Field – Florida/CDF/CMS
PYTHIA Tune DW How well did we do at predicting the “underlying event” at 900 GeV and 7 TeV? Warning! All the UE studies look at charged particles with pT > 0.5 GeV/c. We do not know if the models correctly describe the UE at lower pT values! Tune DW Tune DW • I am surprised that the Tunes did as well as they did at predicting the behavior of the “underlying event” at 900 GeV and 7 TeV! Tune DW Rick Field – Florida/CDF/CMS
ATLAS Tune AMBT1 Judith Katzy LPCC MB&UE working group meeting, May 31, 2010. Emily Nurse ICHEP, July 24, 2010. ATLAS-CONF-2010-031 Rick Field – Florida/CDF/CMS
ATLAS Tune AMBT1 Subset of the “min-bias” data! • Attempt to fit a subset of the “min-bias” data (Nchg ≥ 6) where the contamination due to diffraction is expected to be small! Rick Field – Florida/CDF/CMS
PYTHIA Tune Z1 • All my previous tunes (A, DW, DWT, D6, D6T, CW, X1, and X2) were PYTHIA 6.4 tunes using the old Q2-ordered parton showers and the old MPI model (really 6.2 tunes)! PARP(90) PARP(82) Color • I believe that it is time to move to PYTHIA 6.4 (pT-ordered parton showers and new MPI model)! Connections Diffraction • Tune Z1: I started with the parameters of ATLAS Tune AMBT1, but I changed LO* to CTEQ5L and I varied PARP(82) and PARP(90) to get a very good fit of the CMS UE data at 900 GeV and 7 TeV. • The ATLAS Tune AMBT1 was designed to fit the inelastic data for Nchg ≥ 6 and to fit the PTmax UE data with PTmax > 10 GeV/c. Tune AMBT1 is primarily a min-bias tune, while Tune Z1 is a UE tune! UE&MB@CMS Rick Field – Florida/CDF/CMS
PYTHIA Tune Z1 Parameters not shown are the PYTHIA 6.4 defaults! Rick Field – Florida/CDF/CMS
CMS UE Data CMS CMS Tune Z1 • CMS preliminary data at 900 GeV and 7 TeV on the “transverse” charged particle density, dN/dhdf, as defined by the leading charged particle jet (chgjet#1) for charged particles with pT > 0.5 GeV/c and |h| < 2.0. The data are uncorrected and compared with PYTHIA Tune DW and D6T after detector simulation (SIM). • CMS preliminary data at 900 GeV and 7 TeV on the “transverse” charged particle density, dN/dhdf, as defined by the leading charged particle jet (chgjet#1) for charged particles with pT > 0.5 GeV/c and |h| < 2.0. The data are uncorrected and compared with PYTHIA Tune Z1 after detector simulation (SIM). Tune Z1 (CTEQ5L) PARP(82) = 1.932 PARP(90) = 0.275 PARP(77) = 1.016 PARP(78) = 0.538 Color reconnection suppression. Color reconnection strength. Tune Z1 is a PYTHIA 6.4 using pT-ordered parton showers and the new MPI model! Rick Field – Florida/CDF/CMS
PYTHIA 6.2 Tunes UE Parameters Uses CTEQ6L Reduce PARP(82) by factor of 1.8/1.9 = 0.95 Everything else the same! ISR Parameter Tune A energy dependence! (not the default) Intrinsic KT CMS: We wanted a CTEQ6L version of Tune Z1 in a hurry! Rick Field – Florida/CDF/CMS
PYTHIA Tune Z2 My guess! Reduce PARP(82) by factor of 1.83/1.93 = 0.95 Everything else the same! Rick Field – Florida/CDF/CMS
PYTHIA Tune Z2 My guess! Reduce PARP(82) by factor of 1.83/1.93 = 0.95 Everything else the same! PARP(90) same For Z1 and Z2! Rick Field – Florida/CDF/CMS
PYTHIA 8 Tunes R. Corke and T. Sjöstrand CTEQ6L MRST LO** CTEQ6L PT0 = PARP(82) e = PARP(90) Tevatron LHC pT0(W)=pT0(W/W0)e e = PARP(90) pT0 = PARP(82) W = Ecm Rick Field – Florida/CDF/CMS
PYTHIA Tune Z2 PARP(90) much different! Rick Field – Florida/CDF/CMS
CMS UE Data New CMS CMS Tune Z1 Tune Z1 • CMS preliminary data at 900 GeV and 7 TeV on the “transverse” charged PTsum density, dPT/dhdf, as defined by the leading charged particle jet (chgjet#1) for charged particles with pT > 0.5 GeV/c and |h| < 2.0. The data are corrected and compared with PYTHIA Tune Z1 at the generator level. • CMS preliminary data at 900 GeV and 7 TeV on the “transverse” charged particle density, dN/dhdf, as defined by the leading charged particle jet (chgjet#1) for charged particles with pT > 0.5 GeV/c and |h| < 2.0. The data are corrected and compared with PYTHIA Tune Z1 at the generator level. CMS corrected data! CMS corrected data! Very nice agreement! Rick Field – Florida/CDF/CMS
PYTHIA 6.4 Tune Z2 Tune Z2 Tune Z2 • CMS preliminary data at 900 GeV and 7 TeV on the “transverse” charged PTsum density, dPT/dhdf, as defined by the leading charged particle jet (chgjet#1) for charged particles with pT > 0.5 GeV/c and |h| < 2.0. The data are corrected and compared with PYTHIA Tune Z2 at the generator level. • CMS preliminary data at 900 GeV and 7 TeV on the “transverse” charged particle density, dN/dhdf, as defined by the leading charged particle jet (chgjet#1) for charged particles with pT > 0.5 GeV/c and |h| < 2.0. The data are corrected and compared with PYTHIA Tune Z2 at the generator level. CMS corrected data! CMS corrected data! Not good! Bad energy dependence! Rick Field – Florida/CDF/CMS
PYTHIA 8 Tune C4 PY8 Tune C4 PY8 Tune C4 • CMS preliminary data at 900 GeV and 7 TeV on the “transverse” charged PTsum density, dPT/dhdf, as defined by the leading charged particle jet (chgjet#1) for charged particles with pT > 0.5 GeV/c and |h| < 2.0. The data are corrected and compared with PYTHIA 8 Tune C4 at the generator level. • CMS preliminary data at 900 GeV and 7 TeV on the “transverse” charged particle density, dN/dhdf, as defined by the leading charged particle jet (chgjet#1) for charged particles with pT > 0.5 GeV/c and |h| < 2.0. The data are corrected and compared with PYTHIA 8 Tune C4 at the generator level. CMS corrected data! CMS corrected data! Not good! PTsum too small! Rick Field – Florida/CDF/CMS