Download
1 / 52
520 likes | 656 Views
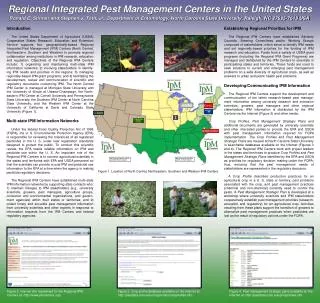
A 13,000-year regional record of Holocene storms in the northeastern United States. Anders Noren University of Vermont Funding: NSF Career Grant EAR-9702643. • Rain-induced erosion • Deposition in lakes. Ritterbush Analyses. PS. MS. CH. GD. LOI. %C. %N. C/N. d 13 C. 1 cm.

E N D
A 13,000-year regional record of Holocene storms in the northeastern United States Anders Noren University of Vermont Funding: NSF Career Grant EAR-9702643
• Rain-induced erosion • Deposition in lakes
Ritterbush Analyses PS MS CH GD LOI %C %N C/N d13C 1 cm
Other Mechanisms • Earthquakes • Snowmelt • Lake-level fluctuations • Removal of vegetation - Drought, disease - Fires - Human activity
Why Storms? • Written records correlate with paleostorm reconstructions - Layer occurrence - Layer thickness • Field observations
The Ritterbush Record 50 cm 2000 2600 Calendar Years BP 5900 6800 8200 9400
Questions Does the Ritterbush record reflect regional processes? • Storm size: Hurricanes or localized storms? (Were layers deposited synchronously in multiple lakes?) • Regional storm trends: Periods of increased storminess? Cycles? Climatic causes/controls?
Lake Characteristics • Steep • Deep • Evidence of sediment transport
Coring Device Driver Head Barrel 6m Piston
Analytical Tools • Magnetic Susceptibility (MS) • X-Radiography (XR) • Visual Logging: color, texture (VL) • Loss-on-Ignition (LOI) • AMS-Radiocarbon Analysis (14C)
0 25 0 50 Depth (cm)
Time Series Filter • Remove negative peaks > 1s from median • SSA reconstruction of remaining series • Peaks > 1s from reconstruction = SIGNIFICANT
COMP Depth (cm)
AMS 14C Analysis • 80 dates • John Southon, Lawrence Livermore National Laboratory
14C Years BP Calendar Years BP
Remove event layers Compress core
Events Dates Model Ages 1400 1400 2100, 2150 3000 3000, 3120 3400, 3790 4800, 4950 5200 5200
Discussion • Storm size • Storm magnitude • Storm frequency —> Climate: New England and North Atlantic
Storm Size Terrigenous Layer End of Record 2 4 6 8 10 12 14 0 Calendar kyr BP
Storm Size Terrigenous Layer End of Record 2 4 6 8 10 12 14 0 Calendar kyr BP • Small storms locally as damaging as large
Terrigenous Layer End of Record 2 4 6 8 10 12 14 0 Calendar kyr BP
Storm Magnitude 7 11-point avg. Avg. Layer Thickness (cm) 0 2 4 6 8 10 12 0 Calendar kyr BP
Storm Magnitude 7 11-point avg. Avg. Layer Thickness (cm) 0 2 4 6 8 10 12 0 Calendar kyr BP • Magnitude highest in early and late Holocene
Spectral Analysis Time Frequency
Another Spectrogram… Time Frequency
Storm Magnitude 7 11-point avg. Avg. Layer Thickness (cm) 0 2 4 6 8 10 12 0 Calendar kyr BP
Storm Magnitude Frequency (cycles/kyr)
Storm Magnitude Frequency (cycles/kyr) • 500-year cycle: Ocean circulation? Solar?
Terrigenous Layer End of Record 2 4 6 8 10 12 14 0 Calendar kyr BP
Storm Frequency 2 4 6 8 10 12 0 Calendar kyr BP
Storm Frequency Frequency (cycles/kyr) • 3000-year cycle
Storm Frequency 2 4 6 8 10 12 0 Calendar kyr BP • 4 maxima; currently increasing—observed?
Cool, moist Warm, dry Cool, moist New England Climate Avg. Fans Freq. Mag. 0 2 4 6 8 10 12 Calendar ky BP
North Atlantic Climate Storm Freq. Coolings Storms Floods GISP2 ssNa GISP2 nssK 0 2 4 6 8 10 12 Calendar kyr BP
Arctic Oscillation High phase • zonal flow • Europe warm Low phase • meridional flow • Europe cold
Factors Pointing to AO Involvement 1. Storminess correlates with GISP2 • GISP2 maxima imply meridional flow • Meridional flow :: low-phase AO 2. Storm maxima occur when Europe is cold • Cold in Europe :: low-phase AO 3. Modern relationship established
North Atlantic Climate Storm Freq. Coolings Storms Floods GISP2 ssNa GISP2 nssK 0 2 4 6 8 10 12 Calendar kyr BP
Implications of AO involvement Dominant atmospheric modes • AO, ENSO Long-timescale climate forcing • Ocean thermohaline circulation • Solar variability
Conclusions 1. Storm Size • Small storms locally as damaging as hurricanes/nor’easters 2. Storm Magnitude • 500-year cycle: cause? • Highest when climate is cool, moist
Conclusions 3. Storm Frequency • 3000-year cycle • 4 Holocene maxima • Currently increasing—observed? • Maxima correlate with fans, floods, storms, cool periods • Relationships consistent with AO • Probable solar forcing
Acknowledgements I thank NSF for funding, and the following people for their work and guidance. Gagan Mirchandani Kyle Nichols Adam Parris Simon Rupard John Southon Eric Steig Stephen Turgeon Carrie Williams Stephen Wright Geohydrology Class 1999 Doug Gomez Sara Gran Rachael Howse Forrest Janukajtis Karen Jennings Neil Kamman Drew Lamneck Andrea Lini Andi Lord Laura Mallard Christine Massey Paul Bierman Andy Bosley Sarah Brown Gordon Chadburn Angie Conlan Ben Copans Jen Cunningham David Fleming Gretchen Fowles Claude Gaboriault Josh Galster
Grain Size Analysis COMP GS (Bosley) COMP GS (Conlan) Depth (cm) 0 500
Arctic Oscillation High phase • zonal flow • Europe warm Low phase • meridional flow • Europe cold
Probability Calendar Years BP