Download
1 / 13
130 likes | 443 Views
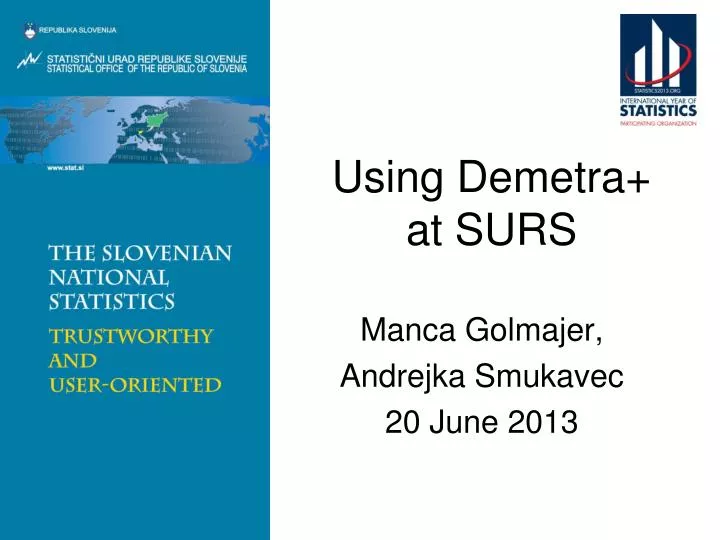
Using Demetra+ at S U RS. Manca Golmajer , Andrejka Smukavec 20 June 2013. Organization of SA. Time series methodologists Modelling (model selection and modification) Training (study, preparation of literature, courses) Contact: zascas.surs@gov.si Survey managers

E N D
Using Demetra+at SURS MancaGolmajer, Andrejka Smukavec 20June 2013
Organization of SA • Time series methodologists • Modelling (model selection and modification) • Training(study, preparation of literature, courses) Contact: zascas.surs@gov.si • Survey managers • Preparation of original data • Automatic seasonal adjustment • Publishing
Seasonal adjustment software and method Software: • Demetra 2.04: until 2013 • Demetra+ 1.0.4: between2013 and 2014/2015 • JDemetra+: from 2014/2015 on Method: • TRAMO/SEATS
Introduction of Demetra+ Gradual introduction of Demetra+ during 2013: • New time series: Demetra+ is used • Old time series: introduction of Demetra+ is joined with annual review
Associated activities • Literature: • Time series manual (for survey managers) • Time series glossary • Seasonal adjustment of time series (methodological explanations) • Commenting of seasonal adjustment of time series • Demetra+ manual (for time series methodologists) • Course for survey managers • Presentation for the Bank of Slovenia and the Institute of Macroeconomic Analysis and Development
Input and output file • Input file: • Excel • One sheet • One type (monthly or quarterly time series) • Dates: first day of the period • Output file: • Excel – ByComponent • Used by most survey managers • Dates: first day of the period • Csv – VTable • Dates: last day of the period
Refreshing • Transformation, calendar effects, regression effects (pre-specified outliers) andthe ARIMA model are fixed, only automatic outlier detection might be enabled for the last few periods. • The refreshing option: Partial concurrent adjustment – All outliers (+params) • Options Concurrent adjustment and Partial concurrent adjustment – Arima and outliers (+params) do the same in our case • Option Partial concurrent adjustment – Last outliers (+params) enables automatic outlier detection for the whole last year
Checking the results • Seasonal adjustment of a time series is successful if: • summary is Good • all the other diagnostics (except for thenumber of outliers) are Good or Uncertain • automatic outlier detection is disabled • If seasonal adjustment of any time series is unsuccessful, the survey manager must send the multi-processing to the time series methodologist to checkandmaybechangethe model (checktheBaddiagnostics, includeanoutlier, etc.).
Some positive things about Demetra+ • It is very user-friendly: • Well organized • Colours are used • Our survey managers like the Excel output • It has a lot of possibilities, tools, tests, etc. It gives the user a lot of informationandbetterunderstandingoftheseasonaladjustmentprocess. • It is much faster to select a model (transformation, calendar effects, outliers, ARIMA model) with Demetra+ than with Demetra.
Some negative things about Demetra+ • We donot like the chart scale.
It is difficult to compare different models for the same time series. • The maximum values for the coefficients of the ARIMA model are (3,2,3)(1,1,1). In Demetra we also used (0,1,1)(0,1,2). In Demetra+ we use (0,1,1)(1,1,1) instead.
Some problemswithDemetra+ • Strangevaluesfor time seriescomponents
Methodological improvements • We can send our questions to ESTAT-Methodology@ec.europa.eu. • We started using trading days effect (6 or 7 regressors). Before we used only working days effect (1 or 2 regressors).