Download
1 / 4
40 likes | 153 Views
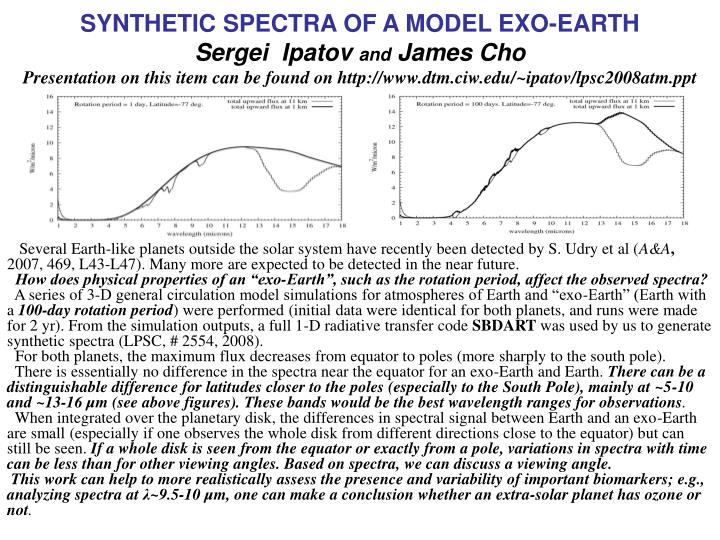
SYNTHETIC SPECTRA OF A MODEL EXO-EARTH Sergei Ipatov and James Cho Presentation on this item can be found on http://www.dtm.ciw.edu/~ipatov/lpsc2008atm.ppt.

E N D
SYNTHETIC SPECTRA OF A MODEL EXO-EARTHSergei Ipatov andJames Cho Presentation on this item can be found on http://www.dtm.ciw.edu/~ipatov/lpsc2008atm.ppt Several Earth-like planets outside the solar system have recently been detected by S. Udry et al (A&A, 2007,469, L43-L47). Many more are expected to be detected in the near future. How does physical properties of an “exo-Earth”, such as the rotation period, affect the observed spectra? A series of 3-D general circulation model simulations for atmospheres of Earth and “exo-Earth” (Earth with a 100-day rotation period) were performed (initial data were identical for both planets, and runs were made for 2 yr). From the simulation outputs, a full 1-D radiative transfer code SBDART was used by us to generate synthetic spectra (LPSC, # 2554, 2008). For both planets, the maximum flux decreases from equator to poles (more sharply to the south pole). There is essentially no difference in the spectra near the equator for an exo-Earth and Earth. There can be a distinguishable difference for latitudes closer to the poles (especially to the South Pole), mainly at ~5-10 and ~13-16 µm (see above figures). These bands would be the best wavelength ranges for observations. When integrated over the planetary disk, the differences in spectral signal between Earth and an exo-Earth are small (especially if one observes the whole disk from different directions close to the equator) but can still be seen. If a whole disk is seen from the equator or exactly from a pole, variations in spectra with time can be less than for other viewing angles. Based on spectra, we can discuss a viewing angle. This work can help to more realistically assess the presence and variability of important biomarkers; e.g., analyzing spectra at λ~9.5-10 µm, one can make a conclusion whether an extra-solar planet has ozone or not.
Triggering presolar cloud collapse and injection of short-lived radioisotopes (such as 26Al and 60Fe) with an outflow from a massive star. Sergei Ipatov and Alan Boss FLASH code was used to calculate the evolution of a presolar cloud (initially the Bonner sphere) caused by a moving shock front. 2D (cylindrical coordinates) and 3D (Cartesian coordinates) models were considered. Max density of the sphere equaled to 6.2e-19 g/cm3; R_init=1.79e17 cm, T_ambient=10 K, front: max dens=3.6e-20, other: 3.6e-22. We obtained that shocks with isothermal thermodynamics and speeds in the range of 5 to 30 km/s are able to both trigger collapse and inject shock wave material. For 2D and 5 levels, log density equal to -12 was reached in 250, 180, and 160 Kyr for speed of 5, 10, and 20 km/s, respectively. At v=30 km/s, log dens=-12.3 was reached. More material of the front was left near the sphere at v=5 km/s than for greater velocities. There was no collapse to log dens=-15 at v≤3.5 and v≥35 km/s. For 3 levels (3D or 2D), max increase of density was by a factor of ~20-30 (in 120-130 Kyr). There were also dense regions outside the main dense region. For a pure sphere without a front, the sphere slowly expended outside. Upper figure: Initial data for 2D model. Lower figure: 3D model, v=20 km/s, 60 Kyr, xy plane. Only material outside the sphere is considered in the figure, and “fingers” of this material are seen.
Dynamics of small bodies and dust in the solar systemPresentation on this item was made at DTM a year ago and can be found onhttp://www.dtm.ciw.edu/ipatov/dtm2007.ppt Some recent publications on this item: Ipatov, S.I., Kutyrev, A., Madsen, G.J., Mather, J.C., Moseley, S.H., Reynolds, R.J., Dynamical zodiacal cloud models constrained by high resolution spectroscopy of the zodiacal light, Icarus, v. 194, N. 2, 769-788 (2008). Ipatov, S.I. and Mather, J.C., Migration of comets to the terrestrial planets, Proc. IAU Symp. No. 236 “Near-Earth Objects, Our Celestial Neighbors: Opportunity and Risk”, 55-64 (2007). Ipatov, S.I. and Mather, J.C., Migration of dust particles to the terrestrial planets, Proc. “Dust in Planetary Systems”, ESA Publications, SP-643, 91-94 (2007). All publications can be got viahttp://www.dtm.ciw.edu/ipatov/list-publications.htm . Some conclusions: A relatively small fraction (~0.0001-0.001) of Jupiter-crossing objects (JCOs) which transit to orbits with aphelia inside Jupiter’s orbit (Q<4.2 AU) and reside such orbits during more than 1 Myr may contribute significantly in the NEO supply. A probability of a collision of one object with a terrestrial planet can be larger than that of 10,000 other objects. Former JCOs can get any Amor, Apollo, Aten and inner-Earth objects’ orbits and move in such orbits for millions years. The total mass of water delivered from regions outside Jupiter’s orbit to the Earth during planet formation could exceed the mass of the Earth’s oceans. The mass of water delivered to Venus can be of the same order of magnitude and that delivered to Mars can be less by a factor of 3 or 4. Ancient Venus and Mars could have large oceans. Fractions of asteroidal particles, cometary particles originated inside of Jupiter's orbit, and particles originated beyond Jupiter's orbit can be about 1/3 each, with a possible deviation from 1/3 up to 0.1-0.2.
Deep Impact project A. Removal of cosmic ray signatures on DI images Ipatov, S.I., A’Hearn, M.F., and Klaasen, K.P., Automatic removal of cosmic ray signatures on Deep Impact images, Advances in Space Research, v. 40, 160-172, (2007). Codes for removal of cosmic ray signatures can be found onhttp://www.astro.umd.edu/~ipatov/CRcodes.htm . B. Analysis of velocities and amounts of material ejected after the DI collision Velocities and relative amounts of material ejected from Comet 9P/Tempel 1 are studied based on images made by Deep Impact cameras during the first seven minutes after the collision of the Deep Impact impactor with the comet. We considered the velocities v of the particles that give the main contribution to the brightness of the cloud of ejected material, i.e., mainly of particles with diameter d < 3 μm. Estimates of projections of mean velocities of the leading edge of the observed dust cloud onto the plane perpendicular to the line of sight are about 200 m/s and are in accordance with the estimates based on ground-based observations. Some material ejected during the first three seconds had velocities greater than 1 km/s, but the contribution of such material to the total amount of material ejected after the impact was small. The rate of production of observed ejected material probably had a peak at 0.5-0.7 s. At time of ejection 8 < te < 20 s, it could be greater than that at 4 < te < 8 s. The rate probably mainly decreased with time at te > 1 min. Our studies do not contradict to a considerable continuous ejection of material during 7 minutes after the collision. Ejection with velocities v>100 m/s could last for a longer time interval than it was predicted by theoretical models and could take place when there was ejection with smaller velocities.The studies testify in favor of a model close to gravity-dominated cratering (i.e., in favor of greater amounts of ejected material and greater size of a crater). Ipatov, S.I. and A’Hearn, M.F., Velocities of material ejected after the Deep Impact collision, Abstracts of 39th LPSC, #1024, (2008). This presentation can be found onhttp://www.dtm.ciw.edu/~ipatov/lpsc2008di.ppt. A paper will be submitted soon. These 4 slides can be found onhttp://www.dtm.ciw.edu/~ipatov/dtm-march2008.ppt