Download
1 / 27
270 likes | 456 Views
National work with the GAINS model : experiences from Sweden and other countries Работы в рамках модели GAINS на национальном уровне: опыт Швеции и других стран. Stefan Åström, IVL Swedish Environmental Research Institute Ltd. Outline. A brief presentation of the GAINS model

E N D
National workwith the GAINS model: experiences from Sweden and othercountriesРаботы в рамках модели GAINS на национальном уровне: опыт Швеции и других стран Stefan Åström, IVL Swedish Environmental Research Institute Ltd.
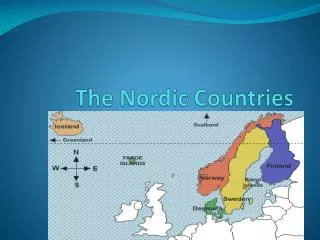
Outline • A brief presentation of the GAINS model • Examplesof research activities in national GAINS modellinggroups: • Sweden • Netherlands • Ireland • Italy • Finland • Russia
The GAINS model – framework GBG Protocol Revised GBG Protocol source: IIASA
Simulation/ “Scenario analysis” mode The GAINS model - structure Energy/agricultural projections PRIMES, POLES, CAPRI,national projections EGTEI, interim reports Emission control options Emissions Costs EMEP model Atmospheric dispersion WHO, CCE, etc source: IIASA Air pollution impacts, Basket of GHG emissions
The GAINS model – exampleresults Loss in lifeexpectancyattributableto fine particulatematter [months] • 2020 2020 • CAFE baseline Maximum technical Current legislationemission reductions source: IIASA
The GAINS model – exampleresults Amann, 2010
IIASA recognition from Atmosfera 2009EECCA country data needs for further improvement • Macroeconomic projections • Projections of emission generating activities: • Energy • Transport • Agricultural projections (livestock numbers) • Activities of heavy industries • Growth of NMVOC generating sectors • Fuel quality, country-specific emission and cost factors • ‘Current legislation’ penetration of control technologies Also (if possible) • Potentials for switching to energy efficient and low CO2 technologies Cofala, 2009
IIASA conclusions from Atmosfera 2009 • GAINS has been used in many policy-relevant studies at the CLRTAP and EU level • Depending on the purpose, different model features are applied • Preliminary databases and assessment available also for EECCA countries • Data and results can be viewed via the internet • Tutorial is available also in Russian • Important updates of database for EECCA countries needed • Can be done only in close collaboration national experts PLEASE HELP!!! Cofala, 2009
GAINS activities in national groups ~15 countriesarenowworkingactivelywithIntegratedAssessmentModels, outofwhich 6 with GAINS This presentation shows examples from 5 countries, but all 5 countriesareworking in severalother research areas as well
Sweden:Nordic low CO2 emission scenarios in GAINS Emission reductions baseline vslow emission scenarios *’Other’ emissions is applicable in the 'What-if' scenario. *Germany and Poland are in the emission calculations included in the group Other.
life months loss – ’what-if’ life months loss - BSL Sweden: Nordic low CO2 emission scenarios in GAINS Health improvementswouldoccurfar from the Nordic countriesif Nordic countrieswereto export surpluselectricitytoGermany and Poland o
Sweden: Nordic low CO2 emission scenarios in GAINS The Nordic net abatement costs following the low emission scenarios Different climatestrategies, leadtovaryingcostsburdens for theNordic countries
Netherlands – GAINS NL Modellingframeworktoassessexceedancesof NO2 and PM10 along city streets and motorways Aben, 2010
Ireland – GAINS Ireland Presentinguncertainty in GAINS modelling King, 2010
Italy – GAINS Italy Comparison GAINS – Inventory 2005 (preliminaryresults) Pignatelli, 2009
Finland – FRES model Karvosenoja, 2010
Finland – FRES model Karvosenoja, 2010
Swedish / Russian co-operation Exploring transboundary impactof PM2.5 emissions (as an addition toprevious presentation)
Whatwouldhavehappenedif Western Europedid not control PM2.5 emissions? • If 29 Europeancountries (not includingRussia) wouldhave a VERY low ambition level: • The European emissions of PM2.5 would be ~13500 ktonof PM2.5 in 2010 • Thesehigher emissions would cause a reduction in averagelifeexpectancyof7.8 months per person in Russia (reduction in lifeexpectancydueto ambient air concentrationof PM2.5) (verylow ambition levelincludes a useofcyclone emission removaltechnology in for 50 % of the fuelused in the Power plants, Industry and conversionsectors)
Whatifsomecountriesweretouse all technologiesavailabletoreduceprimary PM2.5 emissions from stationarysources? • Polish max PM2.5 reductionefforts in 2010: • European emissions wouldhavebeen ~12500 kton PM2.5 • reduced ave. lifeexpectancy in Russiawould be 7.7 months / person • Polish + Belarus max PM2.5 reduction in 2010: • European emissions wouldhavebeen~12250 kton PM2.5 • reducedave. lifeexpectancy in Russiawould be 7.5 months / person (Max PM reductioneffortsincludeuseofhighefficiencydeduster emission removaltechnology in 100 % of the fuelused in the Power plants, Industry and conversionsectors, as well as a 100 % useofmostefficienttechnology in othersectors)
The current situation - emissions of fine particulatematter (PM2.5) • In the National 2010 Baseline, the European (inclRussia) emissions of PM2.5 is estimatedto be ~3500 kton in 2010 • These emissions cause a reduction in averagelifeexpectancyof 6.8 months per person in Russia, dueto exposure tohighbackgroundconcentrationsof PM2.5 (reduction in lifeexpectancyduetoambient air concentrationof PM2.5)
And whatif 29 countrieswouldhaveusedall technologiesavailabletoreduceprimary PM2.5 emissions from stationarysources? • Euro29 max PM reductionefforts in 2010: • European emissions wouldhavebeen~2900 kton PM2.5 • reducedave. lifeexpectancy in Russiawould be 6.7 months / person
And whatif the European part ofRussiaalsowouldhaveimplemented all technologies? • Four scenarios for the European part ofRussia in 2010: • 100 % Highefficiencydeduster in power plants and industry • Europe emissions ~2850 kton PM2.5, Russian loss in ave. lifeexpectancy 6.5 months / person • Maximum efforts in households and waste management etc • Europeemissions ~2750 ktonPM2.5, Russianloss in ave. lifeexpectancy 6.1 months / person • Maximum efforts in process industry • Europeemissions ~2570 ktonPM2.5, Russian loss in ave. lifeexpectancy5.5 months / person) • Cumulativeeffectof the above • Europeemissions ~2380 kton PM2.5, Russian loss in ave. lifeexpectancy4.7 months / person)
And whatif the European part ofRussiaalsowouldhaveimplemented all technologies? • PM2.5 Emission reductions in EuropeanRussiawillhave an impact on the rest ofEurope • The anticipatedyearsoflifelost in EuropeoutsideRussiawould be reduced by 10 million lifeyears.
Further information www.rusaco.se
Conclusions • GAINS modellinghelps the international work on reducing emissions of air pollutants • National modellers canalsouse the model for analysis • National developmentsof GAINS modelworkrequireresources and expertise • DevelopmentofRussianworkwith the GAINS modelshold be encouraged. Both for domestic and international purposes
Thankyou More information: http://www.iiasa.ac.at/rains Access to the on-line model: http://gains.iiasa.ac.at/gains/ Information about the Swedish/Russian co-operation project: www.rusaco.se (in russian)