Download
1 / 1
30 likes | 208 Views
Testing probabilistic seismic hazard estimations against observations , application to France . Hilal TASAN , Céline Beauval , Agnès Helmstetter , Philippe Guéguen ISTerre , Grenoble, France hilal.tasan@ujf-grenoble.fr. Checking validity of the required hypothesis in testing.

E N D
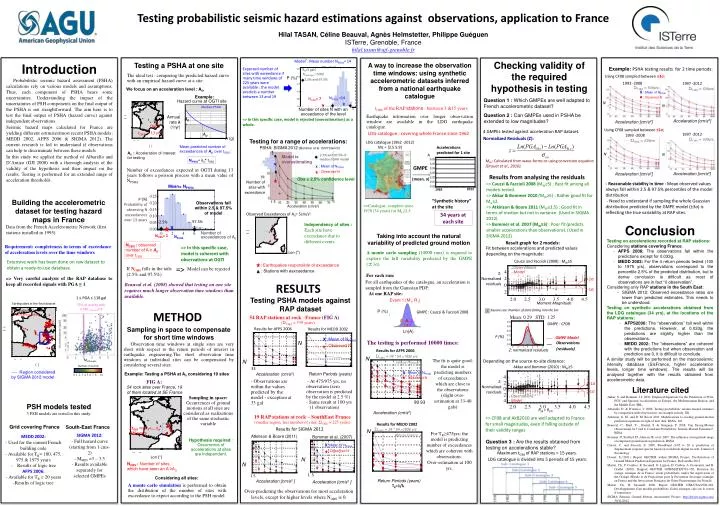
Testing probabilistic seismic hazard estimations against observations, application to France HilalTASAN, Céline Beauval, AgnèsHelmstetter, Philippe Guéguen ISTerre, Grenoble, France hilal.tasan@ujf-grenoble.fr Checking validity of the required hypothesis in testing Testing a PSHA at one site Introduction Probabilistic seismic hazard assessment (PSHA) calculations rely on various models and assumptions. Thus, each component of PSHA bears some uncertainties. Understanding the impact of the uncertainties of PSH components on the final output of the PSHA is not straightforward. The aim here is to test the final output of PSHA (hazard curve) against independent observations. Seismic hazard maps calculated for France are yielding different estimates(most recent PSHA models; MEDD 2002, AFPS 2006 & SIGMA 2012). The current research is led to understand if observations can help to discriminate between these models In this study we applied the method of Albarello and D’Amico (GJI 2008) with a thorough analysis of the validity of the hypothesis and their impact on the results. Testing is performed for an extended range of acceleration thresholds. A way to increase the observation time windows: using synthetic accelerometric datasets inferred from a national earthquake catalogue Model*: Mean number NPSHA=14 Example: PSHA testing results for 2 time periods: Expected number of sites with exceedance if many time windows of 225 years were available : the model predicts a number between 13 and 19 The ideal test : comparing the predicted hazard curve with an empirical hazard curve at a site. A0=5 gals Ncatalogue=5000 Using CF08 sampled between ±3σ; P (%) 2.5% and 97.5% 1993 -2008 1997 -2012 We focus on an accelerationlevel : A0, ΣtOBS = 539yrs ΣtOBS = 539yrs X : Mean of NPSHA Question 1 : Which GMPEs are well adapted to French accelerometric dataset? Question 2 : Can GMPEs used in PSHA be extended to low magnitudes? Example: NPSHA =14 : Observed N NOBS= 7 Hazard curve at OGTI site N 54 rock sites X N Median PSHA tOBSof the RAP stations : between 3 &15 years Number of sites N with an exceedance of the level Earthquake information over longer observation window are available in the LDG earthquake catalogue. Annual rate λ (1/yr) λ0 => In this specific case, model is rejected (overestimation) as a whole. Acceleration [cm/s2] Acceleration [cm/s2] OGTI Using CF08 sampled between ±2σ; 4 GMPEs tested against acceleration RAP dataset. tOBS = 13 yrs LDG catalogue : covering whole France since 1962 A0 1997 -2012 1993 -2008 Normalized Residuals (Z): A (g) ΣtOBS = 539yrs ΣtOBS = 539yrs Testing for a range of accelerations: LDG catalogue (1962 -2012) ML = [2.5 5.9] Mean predicted number of exceedances of A0over tOBS: Accelerations predicted for 1 site PSHA: SIGMA 2012 (Bommer et al. 2007 branch) A0 : Acceleration of interest for testing N N A : 2.5% and 97.5% of median PSHA model Model is overestimating NPSHA= λ0* tOBS MW: Calculated from wave-forms or using conversion equation (Drouet et al., 2010). X Number of exceedances expected at OGTI during 13 years follows a poisson process with a mean value of NPSHA. : Mean of NPSHA GMPE X : Observed N Results from analysing the residuals Acceleration [cm/s2] Acceleration [cm/s2] N: Number of sites with exceedance (mean, σ) Obs = 2.5% confidence level - Reasonable stability in time : Mean observed values always fall within 2.5 & 97.5% percentiles of the model distribution - Need to understand if sampling the whole Gaussian distribution predicted by the GMPE model (±3σ) is reflecting the true variability at RAP sites. => Cauzzi & Faccioli 2008 (MW≥5) : Best fit among all models tested. => Akkar & Bommer 2010(MW≥5) : Rather good fit for Mw≥2. => Atkinson & Boore 2011 (MW≥3.5) : Good fit in terms of median but not in variance. (Used in SIGMA 2012) => Bommer et al. 2007 (MW≥3) : Poor fit (predicts smaller accelerations than observations). (Used in SIGMA 2012) Mean= NPSHA 2012 1962 Building the accelerometric dataset for testing hazard maps in France Data from the French Accelerometric Network (first stations installed in 1995). P (%) Probability of observing N exceedances over 13 years “Synthetic history” at the site 75 Observations fall within 2.5 & 97.5% of model 1 5 =>Catalogue: complete since 1978 (34 years) for ML≥2.5 Acceleration (cm/s2) 34 years at each site Observed Exceedances of A0= 5cm/s2 • Conclusion • Testing on accelerations recorded at RAP stations: • Considering stations covering France, • AFPS 2006: The observations fall within the predictions except for 0.033g. • MEDD 2002: For the 4 return periods tested (100 to 1975 yrs), observations correspond to the percentile 2.5% of the predicted distribution, but to derive conclusion is difficult as most of observations are in fact “0 observation”. • Considering only RAP stations in the South East: • SIGMA 2012: Observed exceedance rates are lower than predicted estimates. This needs to be understood. • Testing on synthetic accelerations obtained from the LDG catalogue (34 yrs), at the locations of the RAP stations: • AFPS2006: The “observations” fall well within the predictions. However, at 0.033g, the predictions are slightly higher than the observations. • MEDD 2002: The “observations” are coherent with the predictions but when observation and prediction are 0, it is difficult to conclude. • A similar study will be performed on the macroseismic intensity database (SisFrance, higher acceleration levels, longer time windows). The results will be analysed together with the results obtained from accelerometric data. 97.5% 2.5% Independency of sites : Each site have exceedance due to different events. X Number of exceedances of A0 Taking into account the natural variability of predicted ground motion NOBS= 1 NPSHA Requirement: completeness in terms of exceedance of acceleration levels over the time windows Result graph for 2 models: NOBS : observed number of A ≥ A0 over tOBS A montecarlo sampling (10000 runs) is required to explore the full variability predicted by the GMPE (±3σ). => In this specific case, model is coherent with observations at OGTI • Fit between accelerations and predicted values depending on the magnitude: Lon (°) Extensive work has been done on raw dataset to obtain a ready-to-use database. Cauzzi and Faccioli (2008) : MW≥5 : Earthquakes responsible of exceedance .Observations - Model => If NOBS falls in the tails (2.5% and 97.5%) Model can be rejected : Stations with eaxceedance Z: Normalized residuals => Very careful analysis of the RAP database to keep all recorded signals with PGA ≥ 1 For each run: +1σ For all earthquakes of the catalogue, an acceleration is sampled from the Gaussian PDF: RESULTS Beauval et al. (2008) showed that testing on one site requires much longer observation time windows than available. -1σ At one RAP site: Testing PSHA models against RAP dataset 1 ≤ PGA ≤ 118 gal Event 1 (M1, R1) Moment Magnitude Earthquakes in the final dataset 75% of events with 2 ≤ML_Renass≤ 4 Square size: Number of data falling into the bin 84 stations (54 rock) 656 earthquakes P (%) METHOD . GMPE : Cauzzi & Faccioli 2008 Mean: 0.29 STD: 1.25 54 RAP stations at rock –France (FIG A) A1 A1 A1 Sampling in space to compensate for short time windows Observation time windows at single sites are very short with respect to the return periods of interest in earthquake engineering.The short observation time windows at individual sites can be compensated by considering several sites. (ΣtOBS= 539 years) GMPE : CF08 33 X X X Results for AFPS 2006 Results for MEDD 2002 Ln(A) P (%) GMPE Model X : Mean of NPSHA The testing is performed 10000 times: N • Observations • (residuals) : Observed N Z: normalized residuals Results for AFPS 2006 The fit is quite good: the model is predicting numbers of exceedances which are close to the observations (slight over-estimation at 33-40 gals) ΣtOBS = 34 * 54 =1836 yrs N ML,Renass Depending on the source-to-site distance: N Whole France Akkar and Bommer (2010) : MW≥5 Number of records ---- Region considered by SIGMA 2012 model X : Mean of NPSHA Example: Testing a PSHA at A0 considering 19 sites Return Periods (years) Acceleration (cm/s2) - Observations are within the values predicted by the model - exception at 33 gal - At 475/975 yrs, no observation (zero observation is predicted by the model at 2.5 %) - Same result at 100 yrs (1 observation) : Observed N FIG A: Z: Normalized residuals Literature cited Akkar, S. and Bommer, J.J. 2010. Empirical Equations for the Prediction of PGA, PGV, and Spectral Accelerations in Europe, the Mediterranean Region, and the Middle East. SRL, Albarello, D. & D'Amico, V. 2008, Testing probabilistic seismic hazard estimates by comparison with observations; an example in Italy, GJl. Atkinson, G. M.. and D. M. Boore2011. Modifications to existing ground-motion prediction equations in light of new data, BSSA. 101 Beauval, C., Bard, P.-., Hainzl, S. & Gueguen, P. 2008, Can Strong-Motion Observations be Used to Constrain Probabilistic Seismic-Hazard Estimates?, BSSA. Bommer JJ, Stafford PJ, Alarcon JE, et al. 2007. The influence of magnitude range on empirical ground-motion prediction, BSSA Cauzzi, C. and Faccioli, E. 2008. Broadband (0.05 to 20 s) prediction of displacement response spectra based on worldwide digital records. Journal of Seismology Drouet, S.,(2011). Report GEOTER within SIGMA Project, Pre-Selection of Ground Motion Prediction Equations for France, Deliverable D2-5 Martin, Ch., P. Combes, R. Secanell, G. Lignon, D. Carbon, A. Fioravanti, and B. Grellet (2002). Rapport GEOTER GTR/MATE/0701-150, Révision du zonagesismique de la France: etude probabiliste, under the supervision of the Grouped'Etude et de Proposition pour la Prévention du risquesismique en France and the Association Française du GénieParasismique (in French) Martin, Ch., R. Secanell. 2006. Report GEOTER GTR/CEA/0306-294, Developpement d’un modeleprobabilisted’aleasismiquecalesur le retour d’experience SIGMA (Seismic Ground Motion Assessment) Project.http://projet-sigma.com/ 30/11/2012 +1σ 54 rock sites over France, 19 of them located at SE France -1σ .Observations - Model Sampling in space: Occurrences of ground motions at all sites are considered as realizations of the same stochastic variable PSH modelstested 3 PSH models are tested in this study. 1 5 1 5 90 93 RJB = REPI Acceleration (cm/s2) 19 RAP stations at rock – SouthEastFrance (smaller region, less number of sites, ΣtOBS = 225 years) => CF08 and AkB2010 are well adapted to France for small magnitudes, even if falling outside of their validity ranges Results for MEDD 2002 Grid covering France South-East France For TR≥475yrs: the model is predicting number of exceedances which are coherent with observations. Over-estimation at 100 yrs. ΣtOBS =t1+t2+…..tm 225 years Results for SIGMA 2012 ΣtOBS = 34 * 54 =1836 yrs N • SIGMA 2012: • - Full hazard curve (starting from 1 cms-2) • - MMIN =3 – 3.5 • - Results available separately for selected GMPEs Whole France • MEDD2002: • - Used for the current French building code • - Available for TR= 100, 475, 975 & 1975 years • Results of logic tree • AFPS 2006: • - Available for TR≥ 20 years • -Results of logic tree Atkinson & Boore (2011) Bommer et al. (2007) Question 3 : Are the results obtained from testing on accelerations stable? Hypothesis required : Occurrence of accelerations at sites are independent. X : Mean of NPSHA : Observed N Maximum tOBSof RAP stations = 15 years. Lon (°) N LDG catalogue is divided into 5 periods of 15 years: NOBS : Number of sites which have seen an A ≥AO N Considering all sites: A montecarlo simulation is performed to obtain the distibution of the number of sites with exceedance to expect according to the PSH model. Return Periods (years) Acceleration [cm/s2 ] Acceleration [cm/s2 ] Over-predicting the observations for most acceleration levels, except for higher levels where NOBS is 0. TR=1/λ