Download
1 / 7
70 likes | 218 Views
Figure S1: 5T4 expression in B cell development . Adapted from microarray data published online by van Zelm et al http://franklin.et.tudelft.nl/#bcell [11]. Fig S1. (i). (ii). (ii). C. Figure S2 Expression of 5T4 by B-ALL relapse patients blasts

E N D
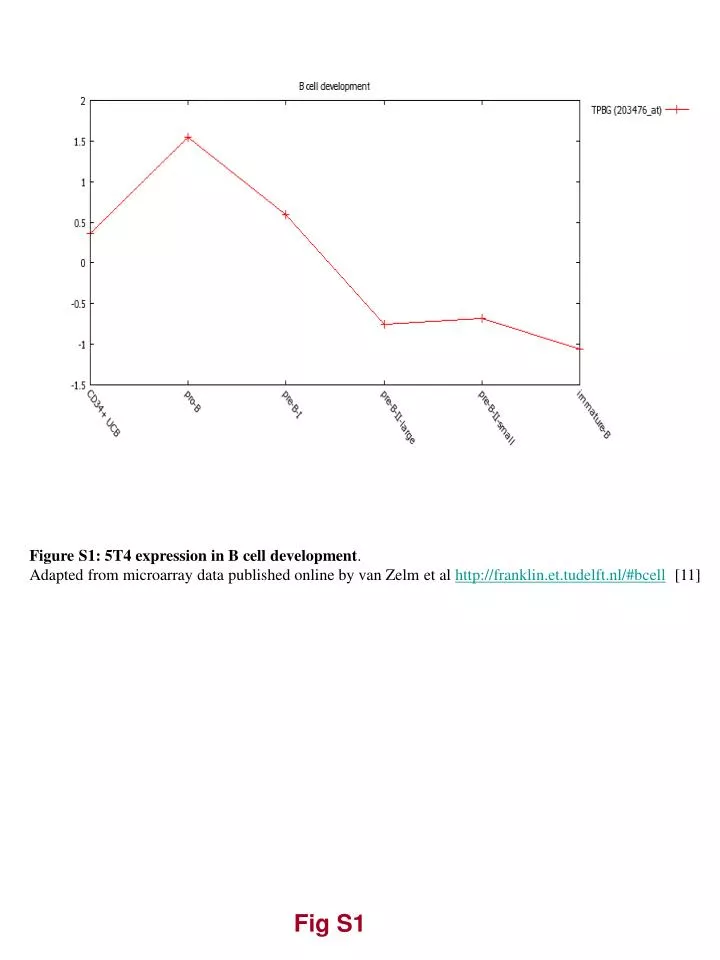
Figure S1: 5T4 expression in B cell development. Adapted from microarray data published online by van Zelm et al http://franklin.et.tudelft.nl/#bcell [11] Fig S1
(i) (ii) (ii) C Figure S2 Expression of 5T4 by B-ALL relapse patients blasts Immunofluorescence staining for 5T4 on DAPI labelled cytospins of bone marrow samples from three relapse patients with pre-B ALL (i-iii) ; magnification x 40, scale bar 5 µm. Fig S2
SD-1 REH NALM-6 TOM-1 Sup-B15 5T4 5T4 CXCR4 composite Z stack brightfield Sup-B15 Sup5T4 CXCR4 TOM-1 composite 5T4 CXCR4 Z stack brightfield Sup A B C Figure S3: 5T4 expression by Pre-B ALL cell lines (A) Flow cytometric analyses show the surface expression of 5T4 on a subpopulation of Sup-B15 cells and at low levels on Tom-1 cells, but not by SD-1, REH or Nalm-6 cells. Surface CXCR4 expression is detected on all cells except SD-1. (B) Characteristic punctate 5T4 (green) labelling of cytospins of Sup-B15 and Tom-1 cells (nuclei labelled with DAPI; blue).(C) Immunofluorescence labelling for 5T4 (green), CXCR4 (red ), composite, Z stack and brightfield images for Sup5T4 and Sup cells; bar is 5µM. Fig S3
Sup Sup5T4 Day 27 ventral images showing assessment of upper and lower abdomen tumour distribution which are presented in Figure 6C as % of total ventral photon count Fig S4
Bone marrow Ovary Sup Sup5T4 5T4 Figure S5: 5T4 phenotypes are stable after iv challenge and only Sup5T4 is found in the ovary Flow cytometric analysis representative of bone marrow and ovary cells isolated from mice (n = 4) injected with the Sup-5T4 sublines (5x10⁶ ; i.v.) at day 30 and gated on the mcherry positive leukemic cells. The 5T4 status of the sublines remained unaltered in vivo over time. Fig S5
Control PBMC PBMC + ANYARA Figure S6: Immunotherapy of Sup5T4 in NSG mice. Ventral images of mice at day 27 after challenge with no treatment, PBMC or PBMC and ANYARA. Fig S6
Table S1: Authentication of Sup-B15, Sup & Sup5T4 cells [13]


![[Fig. S1]](https://cdn3.slideserve.com/6448662/slide1-dt.jpg)


