Download
1 / 46
460 likes | 658 Views
Deforestation Research in the United States: Evidence To Inform the Avoided Deforestation Discussion. Ralph J. Alig USDA Forest Service PNW Research Station Corvallis, Oregon ralig@fs.fed.us Forestry and Agriculture Modeling Forum—March 8, 2007. Outline of Talk.

E N D
Deforestation Research in the United States: Evidence To Inform the Avoided Deforestation Discussion Ralph J. Alig USDA Forest Service PNW Research Station Corvallis, Oregon ralig@fs.fed.us Forestry and Agriculture Modeling Forum—March 8, 2007
Outline of Talk • Recent Trend: Two million acres of U.S. nonfederal rural land converted annually to developed uses • Largest source is forest of land converted to developed uses • Approximately one million acres per year of deforestation (roughly 8-10 times amount in Canada) • Projections for >50 million acres of deforestation by 2050 • Competition for Rural Land Affected by Demands for Developed Land: Study in Progress with FASOM-GHG Model • Impact on costs for GHG offsets, including biofuel • Insights for deforestation incentives and disincentives question in developing countries
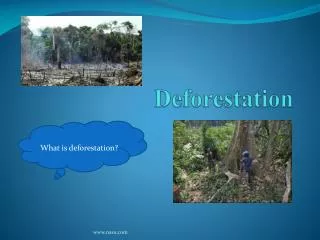
Definition • Deforestation: The conversion of forest to another land use, such that the long-term reduction of the tree canopy cover is below a 10 percent threshold. Deforestation implies transformation into another land use, vs. timber harvesting where the site is likely to revert back to tree cover.
Forestry Intertwined with Cycles Involving Agriculture • Soil Bank Program example • World Demand for Agricultural Crops • Conservation Reserve Program (nation’s largest tree planting program) • Freedom to Farm legislation/Record spending on farm programs
Intersections in the South • Region has large amount of timber harvests • Has many acres suitable for use in either agriculture or forestry • Had relatively large increase in developed area in recent decades • Implications for production possibilities
Demand for land: examples • World demand for agricultural commodities • Green revolution in agriculture and land sparing effects for forestry • Growing population • Technological improvements, productivity increases • Fewer people per household
Forest Transitions • Naturally-regenerated forests converted to planted forests, with more capital into forest sector • More planted forests mean less timber supply and values for natural forests dropping if one considers timber-based values • Will other capital flow into sector for non-timber uses of forests, such as GHG goals, biodiversity, etc; e.g., conservation easements
Biofuels Discussion on Wednesday at the Forum • “How land is used is the big environmental issue” • “Many choices ahead of society”
GHG Implications of Deforestation • 22 million acres deforested between 1982 and 1997, equal to amount of forests in State of Washington • Tens of millions tons of carbon released annually
LAND VALUES: Hierarchy • DEVELOPED USE • AG CROPLAND • FOREST AND PASTURE
Socio-Economic Drivers • *World population to grow from six to nine billion • *National population to grow by 120 million people by 2050, ~ 40%, with increased average personal incomes
Sources and Sinks of U.S.Forestland, 1982-1997 URBAN (Millions of Acres) 0.3 10.2 FOREST 5.6 17.1 6.3 2.0 3.3 3.0 CROP PASTURE & RANGE OTHER Source: USDA NRCS, NRI
Examples of earlier studies--regional • Gravity index that is directly proportional to the population of a city and inversely proportional to the square of the distance between the city and the specific location of interest • Individual gravity index represented the three cities with the most influence • 95 cities in the PNWW region with a population greater than 5,000 (Kline and Alig, PNW)
U.S. Econometric Model • Ruben Lubowski’s PhD work at Harvard • Collaboration with Andrew Plantinga, Oregon State University • Application in the 2010 Resources Planning Act Assessment: Projections of land use change at a county-level
DEFORESTATION SIMULATIONS USING FASOM-GHG MODEL • FASOM-GHG MODEL DISCUSSED BY BRUCE MCCARL AND OTHERS IN OTHER FORUM SESSIONS • SIMULATIONS BY BRUCE MCCARL (in progress) • Funding assistance by EPA
Collaborators Darius Adams, Oregon State Bruce McCarl, Texas A&M Gerald Cornforth, TAMU Greg Latta, Oregon State Brian Murray, RTI Dhazn Gillig, TAMU Chi-Chung Chen, TAMU, NTU Mahmood El-Halwagi, TAMU Uwe Schneider, University of Hamburg Ben DeAngelo, EPA Ken Andrasko, EPA Steve Rose, EPA Francisco Delachesnaye, EPA Ron Sands, PNNL, Maryland Heng-Chi Lee, Taiwan Thien Muang, TAMU Kenneth Szulczyk, TAMU Michael Shelby, EPA Sources of Support USDA Forest Service USEPA
Exogenous amounts of Deforestation TO DEV in the Base Case • Average exogenous loss of forest area to developed uses is more than 6 million acres per decade • Total over 100 years is 60+ million acres • Largest losses are in the South and NE
“Avoiding” Scenarios: FOREST TO DEV • ½ BASE amount • 2X BASE amount • No loss to developed uses
Responses by Agricultural Sector • BASE FOREST <-> AG land transfers with FOREST to DEV scenario • Unconstrained FOREST <-> AG land transfers in response to FOREST to DEV exogenous amount • No land transfers between forestry and agricultural sectors
Responses • Land allocation between forestry and agriculture • Land management within a sector • Changes within processing portions of sectors
NO Deforestation to DEV Amount of Base Case—AG Response • One half the loss of timberland area TO DEV in the base case, in each period and for each region • Agriculture-forestry adjustment allowed, such as other forest land converted to ag. in response to lower forestland value prices • Leakage?
PATHWAYS IN DEFORESTATION MODELING— FULL AG RESPONSE ALLOWED WHEN NO PROJECTED FOREST TO DEV
Summary • U.S. deforestation in recent decades has been substantial, and rate has accelerated • Increasing opportunity costs for keeping land in forest cover • Further baseline projected forest carbon storage loss is substantial, due to more than 60 million acres projected to be deforested over the next 100 years
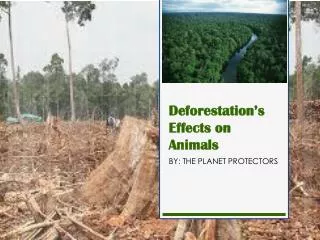
Other Implications • Forest Fragmentation: continuous forests are divided into smaller pieces--by roads, clearing for agriculture, urbanization, or other human land uses • Habitat fragmentation, edge effects, increase in wildland/urban interface, loss of ecosystem services, invasive species pathways • Parcelization: forest ownership tract is divided into smaller ownership tracts
Land Conservation Problems Ahead? • Acceleration in developed area expansion • Increased Demands for Land, Including Biofuels Production • Increasing Opportunity Costs for Land Conservation • Substantial deforestation projected • Implications not only for wildlife, but for traditional land uses (e.g., farming, forestry) and recreation (e.g., hunting, fishing) Photo Source: Theobald
Table 4. Percentage Reduction in Fossil Fuel Emissions by Alternative Biomass Energy Production. Biofuels and Coeffects: Water and Land Conditions (Bruce’s slide)
Low-density housing development • Significant amount of low-density development has been part of the expansion in developed area • Rural residential lots, while fewer in number than urban lots, tend to be larger, averaging nearly 3 acres per household, compared with less than a half acre for urban lots • Forty-four million acres, 60 percent of all rural residential lands, are in the largest lot-size category, over 10 acres
Data Needs • As discussed several times at the Forum this week, large need is for NRI data for 1997+ • Fate of acres (and associated carbon) converted to developed uses • Co-effects
More Info Regarding Forest Service’s Open Space Initiative • http://www.fs.fed.us/openspace/
Wildland-urban interface (WUI) Across the U.S., the 1990s was a period of rapid housing growth, with a net gain of 13.5 million housing units, a rate of 13% growth. • The WUI was a preferred setting for new housing. Nationwide, more than 60% of housing units built in the 1990s were constructed in or near wildland vegetation.
Complementary and Strategic Opportunities Concerning Land Conservation Policies • National: USDA Forest Legacy; next Farm Bill; climate change and energy security; endangered species act • State: Oregon’s Land Use Law and Measure 37 • Local: Boulder’s urban containment policy, and open space/habitat protection • NGO Land Trusts
Avoiding Deforestation: Challenges • How to get the incentives right to slow or stop deforestation • Market mechanisms and beyond: zoning, regulations, etc., e.g., Oregon’s land use law • Mix of FOREST to DEV and FOREST to AG deforestation differs across countries
What’s Next Concerning Land Conservation Analyses • 2010 RPA Assessment of Forest and Range Lands • Multiple resource assessments, including wildlife, outdoor recreation, water, and climate change • Population trends in wildlife species, and future conservation of biological diversity • www.fs.fed.us/pl/rpa