Download
1 / 76
760 likes | 853 Views
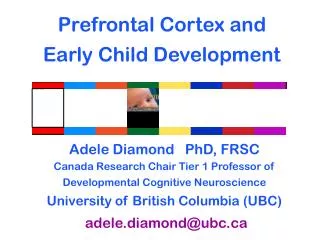
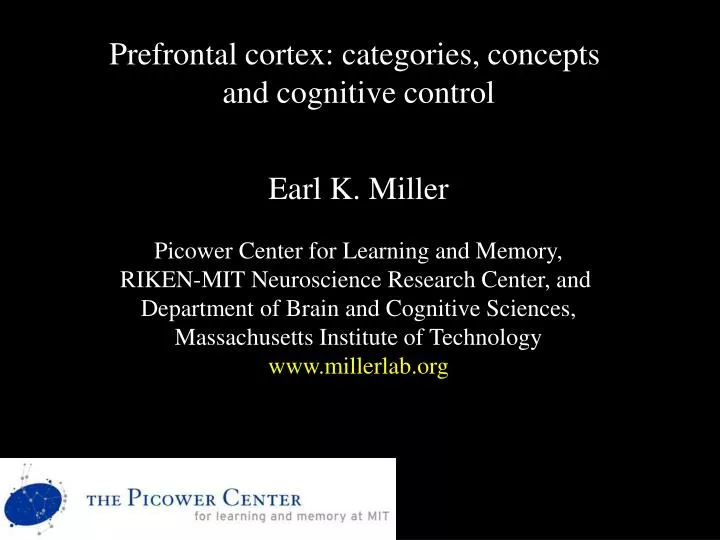
Prefrontal cortex: categories, concepts and cognitive control Earl K. Miller Picower Center for Learning and Memory, RIKEN-MIT Neuroscience Research Center, and Department of Brain and Cognitive Sciences, Massachusetts Institute of Technology www.millerlab.org. Sensory. Motor.

E N D
Prefrontal cortex: categories, concepts and cognitive control Earl K. Miller Picower Center for Learning and Memory, RIKEN-MIT Neuroscience Research Center, and Department of Brain and Cognitive Sciences, Massachusetts Institute of Technology www.millerlab.org
Sensory Motor Executive (cognitive) control – The ability of the brain to wrest control of its processing from reflexive reactions to the environment in order to direct it toward unseen goals. Volition, goal-direction Basic sensory and motor functions
Sensory Motor Consolidation(long-term storage) Learning and memory Memories, habits and skills (Hippocampus, basal ganglia, etc.)
Learning and memory (Hippocampus, basal ganglia, etc.) Executive Functionsgoal-related information Sensory Motor Consolidation(long-term storage)
Learning and memory (Hippocampus, basal ganglia, etc.) Executive Functionsgoal-related information Top-down Selection(flexibility) Sensory Motor Bottom-up Consolidation(long-term storage)
Learning and memory (Hippocampus, basal ganglia, etc.) Executive Functionsgoal-related information Top-down Selection(flexibility) Sensory Motor Bottom-up Consolidation(long-term storage)
Learning and memory (Hippocampus, basal ganglia, etc.) Executive Functionsgoal-related information Top-down Selection(flexibility) Sensory Motor Bottom-up Consolidation(long-term storage)
Learning and memory (Hippocampus, basal ganglia, etc.) Executive Functionsgoal-related information Top-down Selection(flexibility) Sensory Motor Bottom-up Consolidation(long-term storage)
Learning and memory (Hippocampus, basal ganglia, etc.) Executive Functionsgoal-related information Top-down Selection(flexibility) Sensory Motor Bottom-up Consolidation(long-term storage)
Learning and memory (Hippocampus, basal ganglia, etc.) Executive Functionsgoal-related information Top-down Selection(flexibility) Sensory Motor Bottom-up Consolidation(long-term storage)
Learning and memory (Hippocampus, basal ganglia, etc.) Executive Functionsgoal-related information Top-down Selection(flexibility) Sensory Motor Bottom-up Consolidation(long-term storage)
Learning and memory (Hippocampus, basal ganglia, etc.) Executive Functionsgoal-related information Top-down Selection(flexibility) Sensory Motor Bottom-up Consolidation(long-term storage)
Learning and memory (Hippocampus, basal ganglia, etc.) Executive Functionsgoal-related information Top-down Selection(flexibility) Sensory Motor Consolidation(long-term storage)
Our Methods: Train monkeys on tasks designed to isolate cognitive operations related to executive control. Record from groups of single neurons while monkeys perform those tasks.
Learning and memory (Hippocampus, basal ganglia, etc.) Executive Functionsgoal-related information Top-down Selection(flexibility) Sensory Motor Bottom-up Consolidation(long-term storage)
Perceptual Categories David Freedman Maximillian RiesenhuberTomaso Poggio Earl Miller www.millerlab.org
Perceptual Categorization: “Cats” Versus “Dogs” Freedman, D.J., Riesenhuber, M., Poggio, T. and Miller, E.K. (2001) Science, 291:312-316 Freedman, D.J., Riesenhuber, M., Poggio, T. and Miller, E.K. (2002) J. Neurophysiology, 88:914-928. Freedman, D.J., Riesenhuber, M., Poggio, T. and Miller, E.K, (2003) J. Neuroscience, 23:5235-5246 . 60% Dog Morphs 60% Cat Morphs 80% Cat Morphs 80% Dog Morphs Prototypes 100% Dog Prototypes 100% Cat Category boundary
“Cats” Category boundary “Dogs”
Delayed match to category task RELEASE(Category Match) . . . . (Match) Fixation Sample 500 ms. . HOLD (Category Non-match) Delay 600 ms. 1000 ms. Test Test object is a “match” if it the same category (cat or dog) as the sample (Nonmatch)
Fixation Sample Delay Test 13 100% Dog P > 0.1 80:20 Dog:Cat 60:40 Dog:Cat 10 Firing Rate (Hz) Cats vs. DogsP < 0.01 7 4 100% Cat 80:20 Cat:Dog P > 0.1 60:40 Cat:Dog 1 -500 0 500 1000 1500 2000 Time from sample stimulus onset (ms) A “Dog Neuron” in the Prefrontal Cortex
60% Dog Morphs 60% Cat Morphs 80% Cat Morphs 80% Dog Morphs Prototypes 100% Dog Prototypes 100% Cat Category boundary To test the contribution of experience, we moved the category boundaries and retrained a monkey
To test the contribution of experience, we moved the category boundaries and retrained a monkey Old, now-irrelevant, boundary New, now-relevant, boundary
PFC neural activity shifted to reflect the new boundariesand no longer reflected the old boundaries Old, now-irrelevant, boundary New, now-relevant, boundary
Freedman, D.J., Riesenhuber, M., Poggio, T. and Miller, E.K. (2001) Science, 291:312-316 Freedman, D.J., Riesenhuber, M., Poggio, T. and Miller, E.K. (2002) J. Neurophysiology, 88:914-928 ??? Freedman, D.J., Riesenhuber, M., Poggio, T. and Miller, E.K, (2003)J. Neuroscience, 23:5235-5246.
D1 C1 C1 D1 C1 C1 D2 D2 D3 C1 D3 C1 C2 D1 D1 D1 C2 C1 D2 C2 D2 D2 C2 C1 D3 D3 D3 C2 C2 C1 D1 D1 C3 C3 D1 C2 D2 C3 D2 C3 D2 C2 D3 D3 C3 D3 C3 C2 D1 C3 D2 C3 C2 D3 C3 ITC C3 C1 D1 C1 D2 C1 “cats” D3 C1 D1 C2 D2 C2 D3 C2 category boundary D1 C3 D2 C3 D3 C3 “dogs” D1 D3 D2 1.0 0.5 0 Normalized firing rate Category Effects in the Prefrontal versus Inferior Temporal Cortex Activity to individual stimuli along the 9 morph lines that crossed the category boundary PFC Cats Dogs Cats Dogs
PFC ITC Category index values Stronger category effects Category Effects were Stronger in the PFC than ITC: Population Index of the difference in activity to stimuli from different, relative to same, category
Quantity (numerosity) Andreas NiederDavid FreedmanEarl Miller www.millerlab.org
Behavioral protocol: delayed-match-to-number task Release Numbers 1 – 5were used Hold • Preventing the monkey from memorizing visual patterns: • Position and size of dots shuffled pseudo-randomly. • Each numerosity tested with 100 different images per session. • All images newly generated after a session. • Sample and test images never identical. A. Nieder, D.J. Freedman, and E.K. Miller (2002) Science, 297:1708-1711.
Trained Equal area Equal circumference Low density High density Variable features ‘Shape’ Linear Standard stimulus Monkeys instantly generalized acrossthe control stimulus sets.
Standard stimulus Sample Delay Equal area Average sample interval activity
Standard stimulus Sample Delay Variable features Average delay interval activity
Low density Sample Delay High density Average sample interval activity
1 0 0 ) 1 0 0 ) % % ( ( e e s s n 7 5 n 7 5 o o p p s s e e r r 5 0 5 0 d d e e z z i i l l a a m 2 5 m 2 5 r r o o N N 0 0 0 2 4 6 8 1 0 1 2 0 2 4 6 8 1 0 1 2 P r e f e r r e d n u m e r o s i t y P r e f e r r e d n u m e r o s i t y Characteristics of Numerosity • Preservation of numerical order – numbers are not isolatedcategories. • Numerical Distance Effect – discrimination between numbersimprove with increasing distance between them(e.g., 3 and 4 are harder to discriminate than 3 and 7) PFC neurons show tuning curves for number.
Characteristics of Numerosity • Preservation of numerical order – numbers are not isolatedcategories. • Numerical Distance Effect – discrimination between numbersimprove with increasing distance between them. • Numerical Magnitude Effect – discrimination between numbers of equal numerical distance is increasingly difficult as their size increases (e.g., 1 and 2 are easier to tell apart than 5 and 6).
Numerical Magnitude Effect Average width of populationtuning curves Average population tuning curve for each number 1 0 0 3 . 0 ) % ( 2 . 5 7 5 e s n o 2 . 0 p Bandwidth of tuning curves s 5 0 e r 1 . 5 d e z i l 2 5 a 1 . 0 m r o N 0 0 5 1 2 3 4 5 1 2 3 4 5 Numerosity Numerosity Neural tuning becomes increasing imprecise with increasingnumber. Therefore, smaller size numbers are easier todiscriminate.
Scaling of numerical representations Linear-coding hypothesis Non-linear compression hypothesis • symmetricdistributions on linear scale (centered on numbers) • wider distributions in proportion to increasing quantities • symmetric distributions on a logarithmically compressed scale • standard deviations of distributions constant across quantities asymmetric on log scale asymmetric on linear scale
Non-linear scaling of behavioral data Logarithmic scaling
Non-linear scaling of neural data Logarithmic scaling
Scaling of numerical representations Linear-coding hypothesis Non-linear compression hypothesis • symmetricdistributions on linear scale (centered on numbers) • wider distributions in proportion to increasing quantities • symmetric distributions on a logarithmically compressed scale • standard deviations of distributions constant across quantities asymmetric on log scale asymmetric on linear scale
Scaling of numerical representations Linear-coding hypothesis Non-linear compression hypothesis • symmetricdistributions on linear scale (centered on numbers) • wider distributions in proportion to increasing quantities • symmetric distributions on a logarithmically compressed scale • standard deviations of distributions constant across quantities asymmetric on log scale asymmetric on linear scale
Number-encoding neurons A. Nieder and E.K. Miller (in preparation) A. Nieder, D.J. Freedman, and E.K. Miller (2002)Science, 297:1708-1711. A. Nieder and E.K. Miller (in preparation)
Abstract number-encoding neurons Parietal CortexN = 404 Lateral PrefrontalCortexN = 352 Inferior Temporal CortexN = 77 16
Standard stimulus Low density Equal circumference High density Inferior Temporal Cortex
Behavior-guiding Rules Jonathan WallisWael Asaad Kathleen AndersonGregor RainerEarl Miller www.millerlab.org
CONCRETE ABSTRACT Asaad, Rainer, & Miller (1998)(also see Fuster, Watanabe,Wise et al) Asaad, Rainer, & Miller (2000)task context What is a rule? Rules are conditional associations that describe the logic of a goal-directed task. Wallis et al (2001)
Sample Test Release Hold Match Rule(same) Wallis, J.D., Anderson, K.C., and Miller, E.K. (2001) Nature, 411:953-956
Sample Release Hold Sample Test Hold Release Nonmatch Rule(different) Test Wallis, J.D., Anderson, K.C., and Miller, E.K. (2001) Nature, 411:953-956
Sample Release Hold Match Rule(same) Sample Test Hold Release Nonmatch Rule(different) Test The rules were made abstract by training monkeys until they couldperform the task with novel stimuli
+ juice OR Match + low tone + no juice OR Nonmatch + high tone Sample + Cue