Download
1 / 17
170 likes | 286 Views
IMO’s work on control of GHG emissions from ships – response measures. Eivind S. Vagslid Head, Air Pollution and Climate Change Section Marine Environment Division – IMO Joint SBI/SBSTA forum on the impact of the implementation of response measures, SB 34: Bonn, 7 June 2011.

E N D
IMO’s work on control of GHG emissions from ships – response measures Eivind S. Vagslid Head, Air Pollution and Climate Change Section Marine Environment Division – IMO Joint SBI/SBSTA forum on the impact of the implementation of response measures, SB 34: Bonn, 7 June 2011
Modeling and scientific basis for response measures Crude oil tankers: 0 - 9.999dwt 10.000 – 59.999 dwt 60.000 – 79.999 dwt 80.000 – 119.000 dwt 120.000 – 199.999 dwt 200+ dwt Modeling used for emission estimates: 70 ship segments (type and size)
Modeling of 2030 – abatement potential and costs Average marginal CO2 reduction cost per option - World shipping fleet in 2030 (existing and newbuilds) Note; abatement potential for individual ship types and size segments vary widely
MBM Expert Group established by MEPC 60 Developed methodology to asses, inter alia, possible impacts on end consumers and selected industries, in particular in developing countries, and analyzed 10 MBMs proposed by Governments/ NGOs Selected commodities and trades: Iron ore (Dirty Bulk) – Crude oil (Tankers) – Grains (Clean Bulk) – Clothing and furniture (Container) Assumptions and growth scenarios: Size and composition of world fleet – growth scenarios (IPCC A1B: 1.65% and B2: 2.8%) – fuel and carbon prices – uptake of technology – etc. Elasticity estimates of freight rate to fuel price increase:
Nautical distance weighted by bilateral trade MBM-EG concluded that those countries most affected would be those furthest away from their trading partners Ad valorem maritime transport cost Australia Ad valorem maritime transport costs for Chile Average global increase in freight costs equal to a 10% fuel price increase by introducing MBM
Impact Study by MBM-EG Cost pass-through range from 10% cent to over 100% - Great variations between different trades, e.g., ore/containers
Emission reductions in 2030 Modelled emission reductions across various scenarios * Included if the mandatory EEDI is adopted by the committee
Potential climate change financing* Modelled “remaining proceeds” across various scenarios * Excludes financing of out-of-sector emission reductions
IMO’s MBM impact study to continue MEPC 62 to meet in July and continue work on MBMs and to agree on further impacts studies Impact on import costs = 10% fuel price MBM cost in relation to world imports
Impacts of an MBM – Conclusions: Impacts on consumers depend on stringency of MBM, e.g. the carbon price, if it is equal to a 10% increase in fuel price, it translates into a 2 – 10% increase in transport costs and means an increase of 0.0 – 0.2% on end prices and 0.02 – 0.8% of GDP: Market share – Domestic production - Value-to-weight ratio Impacts on developing countries: Will vary by country independent of level of economic development As a result, developing countries, especially SIDS and LDCs, should not be treated as a collective bloc in assessing impacts Those that are closer to their trading partners or have large exporters will, in general, be less affected than countries that are further away or have many small exporters IMO’s MBM impact study to continue www.imo.org
Thank you for your attention! For more information please see: www.imo.org
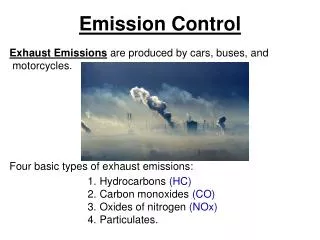
Technical and operational measures New part to MARPOL Annex VI to incorporate mandatory energy efficiency measures (for all ships above 400 GT): • Energy Efficiency Design Index (EEDI) for new ships • Ship Energy Efficiency Management Plan (SEEMP) for all ships using the operational indicator (EEOI) as monitoring tool and for benchmarking • Regulatory text finalized by MEPC 61 (Sept 2010) • To be considered for possible adoption at MEPC 62 • The need for capacity building to enable maritime administrations to implement and enforce the regulations initially considered by MEPC 61
Capacity building needs related to technical and operational measures An initial assessment in line with resolution A.998(25)undertaken by the Vice-Chairman of MEPC and presented to and considered by MEPC 61, which concluded: - Require updating of national legislation - Is intended to and will entail introduction of technological innovations and new practices but, the role of the flag Administration would be limited to ensuring that any new ship flying its flag complies with the new regulations - Administrations may need marginal additional resources (financial and man power), as is the case when any new amendments to IMO conventions are implemented - The financial burden and cost savings will fall on the industry
Capacity building needs cont’d As the regulations address ships, not States, the cost of introducing EEDI and SEEMP will be borne by the industry not the flag Administration Other needs identified: Training of flag State and port State control officers Training of seafarers in use of new technologies Instil in the industry an energy efficiency culture Recommends that IMO’s Integrated Technical Co-operation Programme for the 2012-2013 biennium allocate funding for the training activities and to implement them before the entry into force of the amendments
Planned Technical Cooperation activities 2011 – 2013 related to EEDI and SEEMP Model course for energy efficient ship operation developed by WMU – to be finalized Sept 2011 Capacity building: $650,000 for training activities $200,000 for fellowships Agreement with KOICA for a South East Asian Climate Capacity Building Partnership in the Maritime Transport - $700.000 for 2011 -2013 Dialog with donors for a global project: $5 – 10 millions
Effects of EEDI: 190 – 240 million tonnes CO2 reduced annually compared with BAU by 2030
EEDI and SEEMP Effects Scenario: A1B Optimistic 4000 Technical measures 3500 Operational measures EEDI 39% Alternative fuels 3000 2500 SEEMP 28% 2000 Mt CO2 1500 1000 MBM 500 0 2010 2015 2020 2025 2030 2035 2040 2045 2050