Download

1 / 53
530 likes | 655 Views
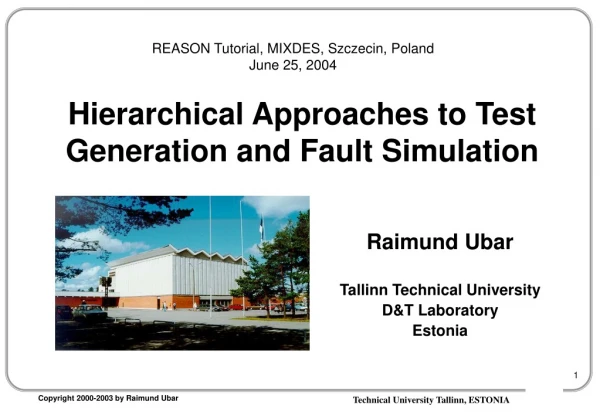
Hierarchical Defect-Oriented T est G eneration. REASON Tutorial Sofia, May 29, 2004. Raimund Ubar Tallinn Technical University D&T Laboratory Estonia. Abstract. H ow to improve the testing quality at increasing complexities of today's systems?

E N D
Hierarchical Defect-OrientedTest Generation REASON Tutorial Sofia, May 29, 2004 Raimund Ubar Tallinn Technical University D&T Laboratory Estonia
Abstract • How toimprove the testing quality at increasing complexities of today's systems? • Two main trends: defect-oriented test and high-level modelling • Both are caused by the increasing complexities of systems based on deep-submicron technologies • The complexity problems in testing digital systems are handled by raising the abstraction levels from gate to register-transfer level (RTL) instruction set architecture (ISA)or behavioral levels • To handle defects in circuits implemented in deep-submicron technologies, new fault models and defect-oriented test methods should be used • Trends to high-level modelling and defect-orientation are opposite • As a promising compromise and solution is:to combine hierarchical approach with defect orientation • Decision Diagrams serve as a good tool forhierarchical modelling of defects in digital systems
Outline • Introduction to Digital Test (3) • How to improve test quality at increasing complexity of systems (11) • High-level modelling and defect-orientation (6) • Decision Diagrams - beyond BDDs (8) • Hierarchical test generation (11) • General concepts • Test generation for RT Level systems • Test generation for Microprocessors • Conclusions
Introduction: the Problem is Money? How to succeed? Try too hard! How to fail? Try too hard! (From American Wisdom) Cost of quality Cost Cost of testing 100% Test coverage function Cost of the fault Time Conclusion: “The problem of testing can only be contained not solved” T.Williams Quality Optimum test / quality 0% 100%
Introduction: How Much to Test? Time can be your best friend or your worst enemy (Ray Charles) Paradox: 264 input patterns (!) for 32-bit accumulator will be not enough. A short will change the circuit into sequential one, and you will need because of that 265 input patterns Paradox: Mathematicians counted that Intel 8080 needed for exhaustive testing 37 (!) years Manufacturer did it by 10 seconds Majority of functions will never activated during the lifetime of the system Y = F(x1, x2, x3) Bridging fault State q 0 y x1 & 1 & x2 * x3 1 Y = F(x1, x2, x3,q)
Introduction: Hierarchy The best place to start is with a good title. Then build a song around it. (Wisdom of country music) Paradox: To generate a test for a block in a system, the computer needed 2 days and 2 nights An engineer did it by hand with 15 minutes So, why computers? Sea of gates & Sequence of 216 bits 16 bit counter 1 System
Two Approaches to Testing Testing of functions: 1 2 Combinational circuit under test 0% 93,75% n 87,5% 4. pat. Truth table Faulty functions covered by 1. pattern 3. pattern Patterns Functions 75% 2n-1 1 00…000 00…001 00…010 … 11…111 01 01 01…101 00 11 00…011 0000 11…111 … 000000…111 2 Faulty functions covered by 2. pattern Number of patterns tested 50%! 2n 2n 2 Number of functions 50% 1
Two Approaches to Testing Testing of structural faults: 1 2 Combinational circuit under test n Not tested faults 4. pat. Fault coverage 3. pat. 100% 2. pattern Faults covered by 1. pattern Number of patterns 4
Two Approaches to Testing Testing of functions: Testing of structural faults: 0% 93,75% 87,5% 4. pat. Not tested faults 4. pat. Faulty functions covered by 1. pattern 3. pattern 3. pat. 75% Faulty functions covered by 2. pattern 2. pattern Faults covered by 1. pattern 100% will be reached when all faults from the fault list are covered 100% will be reached onlyafter 2ntest patterns
Outline • Introduction to Digital Test • How to improve test quality at increasing complexity of systems • High-level modelling and defect-orientation • Decision Diagrams (beyond BDDs) • Hierarchical test generation • General concepts • Test generation for RT Level systems • Test generation for Microprocessors • Conclusions
Complexity vs. Quality Problems: • Traditional low-level test generation and fault simulation methods and tools for digital systems have lost their importancebecause of the complexityreasons • Traditional Stuck-at Fault (SAF) model does not quarantee the qualityfor deep-submicron technologies New solutions: • The complexity can bereduced by raising the abstraction levels from gate to RTL, ISA, and behavioral levels • But this moves us even more away from the real life of defects (!) • To handle adequately defects in deep-submicron technologies, new fault models and defect-oriented test generation methods should be used • But, this is increasing even more the complexity (!) • To get out from the deadlock, these two opposite trends should be combined into hierarchical approaches
Fault and defect modeling Defects, errors and faults • An instance of an incorrect operation of the system being tested is referred to as an error • The causes of the observed errors may be design errors or physical faults -defects • Physical faults do not allow a direct mathematical treatment of testing and diagnosis • The solution is to deal with fault models System Defect Component Fault Error
Transistor Level Faults Stuck-at-1 Broken (change of the function) Bridging Stuck-open NewState Stuck-on (change of the function) Short (change of the function) Stuck-off (change of the function) Stuck-at-0 SAF-model is not able to cover all the transistor level defects How to model transistor defects ?
Mapping Transistor Faults to Logic Level A transistor fault causes a change in a logic function not representable by SAF model Function: y Faulty function: x1 x4 Short 0 – defect d is missing 1 – defect d is present d= Defect variable: x2 Generic function with defect: x5 x3 Mapping the physical defect onto the logic level by solving the equation:
Mapping Transistor Faults to Logic Level Function: Faulty function: Generic function with defect: y x1 x4 Short Test calculation by Boolean derivative: x2 x5 x3
Functional Fault vs. Stuck-at Fault Full 100% Stuck-at-Fault-Test is not able to detect the short: Functional fault The full SAF test is not covering any of the patterns able to detect the given transistor defect
Generalization: Functional Fault Model Fault-free Faulty Constraints calculation: d = 1, if the defect is present Component with defect: Constraints: Component F(x1,x2,…,xn) y Wd Defect Fault model: (dy,Wd), (dy,{Wkd}) Logical constraints
Functional Fault Model for Stuck-ON NOR gate Stuck-on VDD x1 RN x2 Y x1 x2 RP VSS Condition of the fault potential detecting: Conducting path for “10”
Functional Fault Model for Stuck-Open NOR gate Test sequence is needed: 00,10 Stuck-off (open) tx1 x2 y 1 0 0 1 2 1 0 1 VDD x1 x2 Y x1 x2 VSS No conducting path from VDD to VSS for “10”
Functional Fault Model x*k xk d Example: Bridging faultbetween leadsxkandxl The conditionmeans that in order to detect the short between leadsxkand xl on the leadxk we have to assign toxkthe value 1 and toxlthe value 0. xl xk*= f(xk,xl,d) Wired-AND model
Functional Fault Model Bridging fault causes a feedback loop: Example: A short between leads xkand xlchanges the combinational circuit into sequential one x1 y & x2 & x3 Equivalent faulty circuit: x1 y & & x2 x3 tx1 x2 x3 y 1 0 1 0 2 1 1 1 1 Sequential constraints: &
Mapping High level k WFk Component Low level WSk Bridging fault Surrounding Mapping First Step to Quality How to improve the test quality at the increasing complexity of systems? First step to solution: Functional fault model was introduced as a means for mapping physical defects from the transistor or layout level to the logic level System
Outline • Introduction to Digital Test • How to improve test quality at increasing complexity of systems • High-level modelling and defect-orientation • Decision Diagrams (beyond BDDs) • Hierarchical test generation • General concepts • Test generation for RT Level systems • Test generation for Microprocessors • Conclusions
Register Level Fault Models RTL statement: K: (If T,C) RD F(RS1, RS2, … RSm), N Components (variables) of the statement: RT level faults: K K’ - label faults T T’ - timing faults C C’ - logical condition faults RD RD - register decoding faults RS RS - data storage faults F F’ - operation decoding faults - data transfer faults N - control faults (F) (F)’ - data manipulation faults K - label T - timing condition C - logical condition RD - destination register RS - source register F - operation (microoperation) - data transfer N - jump to the next statement
Fault Models for High-Level Components Decoder: - instead of correct line, incorrect is activated - in addition to correct line, additional line is activated - no lines are activated Multiplexer (n inputs log2 n control lines): - stuck-at - 0 (1) on inputs - another input (instead of, additional) - value, followed by its complement - value, followed by its complement on a line whose address differs in 1 bit Memory fault models: - one or more cells stuck-at - 0 (1) - two or more cells coupled
Fault models and Tests Functional fault model Dedicated functional fault model for multiplexer: • stuck-at-0 (1) on inputs, • another input (instead of, additional) • value, followed by its complement • value, followed by its complement on a line whose address differs in one bit Test description
Faults and Test Generation Hierarchy Functional Structural Higher Level Module approach approach ki k Component Lower level WFki S Test F W k WFk WSki System Network Bridging fault F W of modules k Surrounding S Test W F k ki Interpretation of WFk: - asa test on the lower level - asa functional fault on the higher level Module Network F W ki of gates d W Test F ki ki Circuit e Gat
Outline • Introduction to Digital Test • How to improve test quality at increasing complexity of systems • High-level modelling and defect-orientation • Decision Diagrams (beyond BDDs) • Hierarchical test generation • General concepts • Test generation for RT Level systems • Test generation for Microprocessors • Conclusions
Binary Decision Diagrams y 1 Functional BDD x1 1 0 x2 x3 Simulation: x4 x5 01 1 0 1 0 0 Boolean derivative: x6 x7 0
Elementary Binary Decision Diagrams Elementary BDDs: AND x1 x1 x2 x1 x2 x3 y & x2 y x3 + Adder x3 x1 OR x2 x1 y 1 y x1 x2 x3 x3 x2 x2 x3 x3 NOR x1 x2 y x1 x2 x3 1 x3
Building a SSBDD for a Circuit Structurally Synthesized BDDs: DD-library: y a b Given circuit: x1 x1 x22 a a b x21 1 x2 y x21 x3 & x22 1 SSBDD x3 Superposition of DDs b y x22 x22 a y x1 Compare to x3 x3 Superposition of Boolean functions: x21 b a
Macro 1 y & d 2 73 6 & 71 a 1 & e 3 72 7 b 4 5 1 y & 5 73 c 6 71 72 2 0 & & & Representing by SSBDD a Circuit Structurally synthesized BDD for a subcircuit (macro) To each node of the SSBDD a signal path in the circuit corresponds y = cyey = cyey = x6,e,yx73,e,y deybey y = x6x73 ( x1 x2 x71) ( x5 x72)
Macro 1 & d 2 & 71 a & e 3 72 7 b 4 y & 5 73 c 6 & & & Fault modeling on SSBDDs The nodes represent signal paths through gates Two possible faults of a DD-node represent all the stuck-at faultsalong the signal path y 73 6 1 5 1 71 72 2 123 4 5 6 7 y 1 1 0 0 1 1 0 Test pattern:
High-Level Decision Diagrams R Superposition of High-Level DDs: A single DD for a subcircuit 2 0 y # 0 4 1 R 2 M1 0 0 2 y y R + R 3 1 1 2 R2 1 IN + R 2 1 IN 2 R 1 3 0 y R * R 2 R2 +M3 1 2 1 IN* R 2 M2 Instead of simulating all the components in the circuit, only a single path in the DD should be traced
Fault Modeling on High Level DDs • Terminal nodesrepresent: • RTL-statement faults: • data storage, • data transfer, • data manipulation faults High-level DDs (RT-level): • Nonterminal nodes represent: • RTL-statement faults: • label, • timing condition, • logical condition, register decoding, • operation decoding, • control faults
Hierarchical Diagnostic Modeling High-Level DD-s Boolean differential algebra BDD-s Two trends: • high-level modeling • to cope with complexity • low-level modeling • to cope with physicaldefects,to reach higher acuracy
Outline • Introduction to Digital Test • How to improve test quality at increasing complexity of systems • High-level modelling and defect-orientation • Decision Diagrams (beyond BDDs) • Hierarchical test generation • General concepts • Test generation for RT Level systems • Test generation for Microprocessors • Conclusions
Hierarchical Test Generation • In high-level symbolic test generation the test properties of components are often described in form of fault-propagation modes • These modes will usually contain: • a list of controlsignals such that the data on input lines is reproduced without logic transformation at the output lines - I-path, or • a list of control signals that provide one-to-one mapping between data inputs and data outputs - F-path • The I-paths and F-paths constitute connections for propagating test vectors from input ports (or any controllable points) to the inputs of the Module Under Test (MUT) and to propagate the test response to an output port (or any observable points) • In the hierarchical approach, top-down and bottom-up strategies can be distinguished
Hierarchical Test Generation Approaches A System Bottom-up approach: • Pre-calculated tests for components generated on low-level will be assembled at a higher level • It fits well to the uniform hierarchical approach to test, which covers both component testing and communication network testing • However, the bottom-up algorithms ignore the incompletenessproblem • The constraints imposed by other modules and/or the network structure may prevent the local test solutions from being assembled into a global test • The approach would work well only if the the corresponding testability demands were fulfilled a D B C c a,c,D fixed x - free a D A = ax D: B = bx C = cx c Module
Hierarchical Test Generation Approaches Top-down approach: A System • Top-down approach has been proposed to solve the test generation problem by deriving environmental constraints for low-level solutions. • This method is more flexible since it does not narrow the search for the global test solution to pregenerated patterns for the system modules • However the method is of little use when the system is still under development in a top-down fashion, or when “canned” local tests for modules or cores have to be applied a’ D’ B c’ C a’,c’,D’ fixed x - free a’x d’x A = a’x D’ = d’x C = c’x c’x Module
R 2 0 y # 0 4 y y y y 1 1 2 3 4 R 2 0 0 a 2 R · c y y R + R 1 3 1 M + 1 2 1 e 1 · IN + R M R 2 3 2 1 b · IN * M · 2 IN · 2 d R 1 3 0 y R * R 2 1 2 1 IN* R 2 Hierarchical Test Generation on DDs Hierarhical test generation with DDs:Scanning test(defect-oriented) Single path activation in a single DD Data function R1* R2is tested Decision Diagram Data path HL Test program: Control: y1 y2 y3 y4 = x032 Data: For all specified pairs of(R1, R2) Low level test data (constraints W)
y y y y 1 2 3 4 a R · c 1 M + 1 e · M R 3 2 b · * M · 2 IN · d Test Generation on High Level DDs High-level test generation with DDs: Conformity test (High-level faults) Decision Diagram Multiple paths activation in a single DD Control function y3 is tested R 2 0 y # 0 4 Data path 1 R 2 0 0 2 y y R + R 3 1 1 2 1 IN + R 2 1 IN 2 R 1 3 0 y R * R 2 1 2 1 IN* R Control: For D = 0,1,2,3: y1 y2 y3y4 = 00D2 Data: Solution of R1+ R2 IN R1 R1* R2 Test program: 2 Activating high-level faults:
& & & Defect-Oriented Test Generation Component F(x1,x2,…,xn) y Activate a path Test generation for a bridging fault: Bridge between leads 73 and 6 Wd Defect Macro 1 1 d 1 & 2 a & 71 D D • Fault manifestation: • Wd= x6x7= 1: x6=0, x7=1, • x7= D • Fault propagation: • x2=1, x1=1, b =1, c =1 • Line justification: • b = 1: x5= 0 D & e 3 72 7 b 1 4 1 y D D & 5 73 c 1 0 6 Wd
Macro 1 & d 2 & 71 a & e 3 72 7 b 4 y & 5 73 c 6 & & & Test Generation with SSBDDs DefectWd manifestation: Wd= x6x7= 1: x6=0, x7=1, x7= D Functional Fault dx7 propagation: x1=1, x2=1, x5=0 y No fault: dx7 =0: x7=1 73 6 (dx7,Wd) 1 5 1 Bridge between leads 7 and 6:(dx7,Wd) 71 72 2 Test pattern for the node 71 at the constraint Wd= x6x7= 1: Defect: dx7 =1: x7=0 123 4 5 6 7 y 1 10 01 1 0
I1: MVI A,D A IN I2: MOV R,A R A I3: MOV M,R OUT R I4: MOV M,A OUT A I5: MOV R,M R IN I6: MOV A,M A IN I7: ADD R A A + R I8: ORA R A A R I9: ANA R A A R I10: CMA A,D A A Test Generation for Microprocessors High-Level DDs for a microprocessor (example): DD-model of the microprocessor: Instruction set: 1,6 A I IN 3 2,3,4,5 I R OUT A 4 7 A + R A 8 2 A R I A R 9 A R 5 IN 10 A 1,3,4,6-10 R
Test Generation for Microprocessors High-Level DD-based structureofthe microprocessor (example): DD-model of the microprocessor: 1,6 A I IN IN 3 R 2,3,4,5 I R OUT A 4 7 A + R I A OUT 8 2 A R I A R 9 A R 5 A IN 10 A 1,3,4,6-10 R
Test Generation for Microprocessors Scanning test program for adder: Instruction sequence T = I5 (R)I1 (A)I7 I4 for all needed pairs of (A,R) DD-model of the microprocessor: 1,6 A I IN I4 3 OUT 2,3,4,5 I R OUT A I7 A 4 7 A + R I1 A A 8 R IN(2) 2 A R I A R I5 R 9 A R 5 IN(1) IN Time: 10 t t - 1 t - 2 t - 3 A 1,3,4,6-10 Observation Test Load R
Test Generation for Microprocessors Conformity test program for decoder: Instruction sequence T = I5 I1 DI4 for all DI1 -I10 at given A,R,IN DD-model of the microprocessor: 1,6 A I IN Data generation: 3 2,3,4,5 I R OUT A 4 7 A + R A 8 2 A R I A R 9 A R 5 IN 10 A 1,3,4,6-10 Data IN,A,R are generated so that the values of all functions were different R