Download
1 / 12
120 likes | 248 Views
Washington State Population and Employment Data 2010-2030. WACTC Accountability and Allocation Task Force September 2013 Summary and Implications. State/regional population trends and projections for community and technical college participation:. Highlights

E N D
Washington State Population and Employment Data2010-2030 WACTC Accountability and Allocation Task Force September 2013 Summary and Implications
State/regional population trends and projections for community and technical college participation: • Highlights • Key college age populations (15-44 years) will increase 12% between 2011 and 2030. 15-19 year olds will grow by 8%, while 20-44 year olds will increase by 13%. Population growth will be smaller than what occurred in the preceding 20 year period (1991-2010) with marked differences in the growth within age groups. • If current college participation rates are maintained, population growth will mean 10% growth in state and Running Start enrollments by 2030, substantially less growth than occurred between 1991-2010. • There are regional differences for population growth, educational attainment, race/ethnicity, and limited English. • Future skill requirements needed for employment will demand substantial growth in long certificates and 2 year degrees.
Population change in the coming 20 years will be smaller than the previous 20 years.
High school graduating classes will be smaller than 2010 peak until 2027, when they reach a new peak
Eight sub-state regions are used to show disaggregated state data
If current participation rates are maintained, CTC headcount will increase 10% over next 20 years, about half the % increase during preceding twenty years
Student headcount growth due to population changes by age will vary within regions
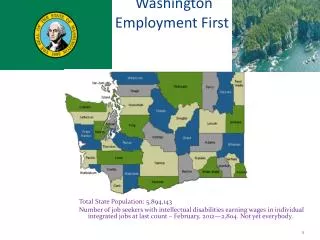
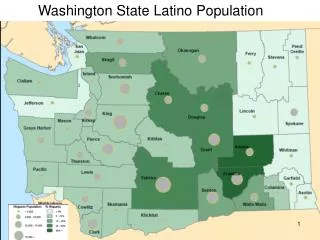
Washingtonians of color are in higher proportions in the central and east regions, King, Snohomish and Pierce counties
64% of Washingtonians 18-44 years have less than an associate degree
Adults with limited English are most heavily concentrated in the central and east regions, King and Snohomish counties
To meet demand for sub-baccalaureate workers (prof tech and academic transfers who go directly to work) , CTCs will have to complete 45,000 to 52,200 students every year from 2016 to 2021. This completion target increases substantially in 2025 and again in 2030. *This is from the upcoming Skilled and Educated Workforce (Joint Report). The low range is the entry education level and the high is the competitive education level. **Extrapolated by SBCTC staff from 2021 going forward.
Some Implications • Much slower enrollment growth, especially among new high school graduates. Increasing competition for young adult students, including with universities? • Most growth by people of color and 35-44 year olds. Impact on outreach and access strategies? • Growing gap between employment demand and CTC supply (10% enrollment growth, 53% employment growth). Can’t meet economic demand with population growth. Improve access for placebound, working adults without college credentials, basic skills needs? • Greatest growth needed in basic skills and workforce training. Impact on mission mix and funding? • More older students. Focus on acceleration and competencies? • Focus on retention and student completions? • Enrollment accountability or student achievement accountability?