Download
1 / 18
220 likes | 445 Views
Accessibility Analysis in GIS. Using a Network Data Model. Why worry about accessibility?. At broad scales, cities exist in part as mechanisms for meeting & trade The future growth of Albacete is in part dependent on its accessibility, especially relative to other competing economic centers

E N D
Accessibility Analysis in GIS Using a Network Data Model
Why worry about accessibility? • At broad scales, cities exist in part as mechanisms for meeting & trade • The future growth of Albacete is in part dependent on its accessibility, especially relative to other competing economic centers • Within a city, accessibility is a key component of economic differentiation in land uses
Key Characteristics of Accessibility • It is a network property • Network alignments are influenced by many natural and cultural features • Typically ports, rivers and steep slopes • Once route/alignment is in place, “user’s view” is mostly a function of time and cost • Historically, used to measure distance/cost to “central place” • Now often important to consider multiple places (polynuclear cities at one scale, a set of neighborhood amenities at another)
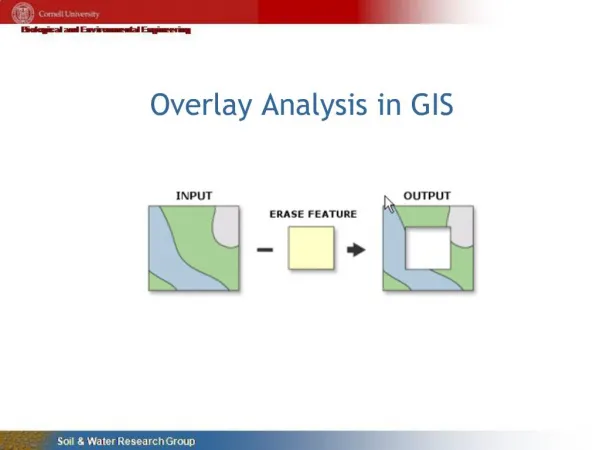
Measures of Accessibility • Simplest Measures • Single mode (ignoring walk or drive to station, etc) • Look at single/major destinations only • E.g. Travel Time in minutes to Madrid from Central Albacete by Passenger Car; Travel time to Alicante by Train • Important Proxies • “As the crow flies” – works well if transportation network is dense and well connected • Voronoi / Theissen polygons. Built in to GIS. Starting with points, buffers half-way to nearest neighbor. Good proxy for area of influence / service areas.
Accessibility Measures • Usually Combine… • Travel Cost to a Destination • Measure of Attractiveness of that Destination • Travel ‘Costs’ • Time • Literal cost • Environmental cost (energy consumption, pollution, etc.) • Reliability • Attractiveness of Destinations • Population • Employment • Gross Regional Product • Visitor Counts
Summary Accessibility Measures • Gutierrez (2001 – In Course Reader) Identified 3 Major Aspects • Weighted Average Travel Time • For example from Albacete to other Spanish towns weighted by population • Economic Potential • Regional economic activity weighted by travel time • Daily Accessibility • 3-4 hour transit time threshold • Theory is that avoiding overnight stays is important both in business and personal travel
Why quantify accessibility? • Academically • To look systematically at differences • In snapshot view, to help explain locational preferences • In time series view, to help explain growth and competitive position • Economically • To conduct trade-area or service-area analysis • Key factor in success or failure of retail, commercial, industrial and residential development • As such, important in assessing fair market value, investment opportunities
How to quantify accessibility • General Steps • Add attributes to line segments to express travel time or cost per link • Create network/node topology from transportation elements such as road centerlines and stations • Select origin and destination nodes • GIS calculates cumulative travel cost/distance • (Optionally) create service areas reflecting land accessible within a given time constraint
Technical Methods Accessibility as implemented specifically in ESRI ArcGIS
Add attributes to segments to express travel time or cost per link • Best done in advance using ArcMap • Why? Because with appropriate naming, Network Analyst defaults parameters • What are the key words? • Literally “hours”, “minutes”, “seconds” for time • “Cost” for cost • General Method • Add fields to line attribute table • Calculate field values sequentially
Attributes for Travel Time Estimation • Want attributes which express the length of time taken to traverse a segment • Could use actually traffic data, where available (and we have some) • Simple proxies to get started: • “free flow” traffic traveling at speed limit • Speed limit determined entirely by road class
Adding Shape Length • Needed • Only with “shape” files • Personal and file-based geodatabase calculate automatically • Units • Are expressed in “coverage units” • In our case, projection is UTM, so units are meters (in State Plane feet would be feet)
Adding Arc Length Attributes in ArcGIS 9.2 • Open the line attribute table • Create a new field called “Km” of type double • Options button/menu->Add Field… • Make sure your selection is clear • Calculate Geometry • Select kilometers as length units (facilitates later)
Adding Temporal Segment Attributes • Speed normally expressed in miles or kilometers per hour • Need segment traversal times in a range of units (for flexibility in results reporting) • Start with number of *hours* to traverse a segment = kilometer length field / speed in kmph • Then calculate minutes = hours * 60 • And finally seconds = minutes * 60
(Re)organizing data for Network Analysis • The Network Analyst *requires* that GIS data be kept in a specific format • Must be a geodatabase (personal or file-based) • Must be inside of a “feature dataset” (a number of feature classes sharing a common projection) • General method • Use ArcCatalog • Create empty geodatabase • Create empty feature dataset inside the geodatabase • Copy or move your transportation feature classes • Create “Network Dataset” • Switch to ArcMap, and use Network Analyst toolbar functions to create routes, service areas, etc.
In-Class Assignment • Pick a travel mode: • Road • Car • Heavy Truck • Rail • Current Passenger Rail • Passenger Rail + New AVE • Current Freight Rail
In-Class Assignment • For each of the following cities, create a route from Albacete and determine the average/max travel *time* • Madrid • Valencia • Alicante • Cuenca • Murcia
In-Class Assignment • For each of the following cities, create a 4-hour service area, and determine the overall area and urbanized area within it • Albacete • Zaragoza • Ciudade Real • Alicante • Cuenca