Download
1 / 1
10 likes | 106 Views
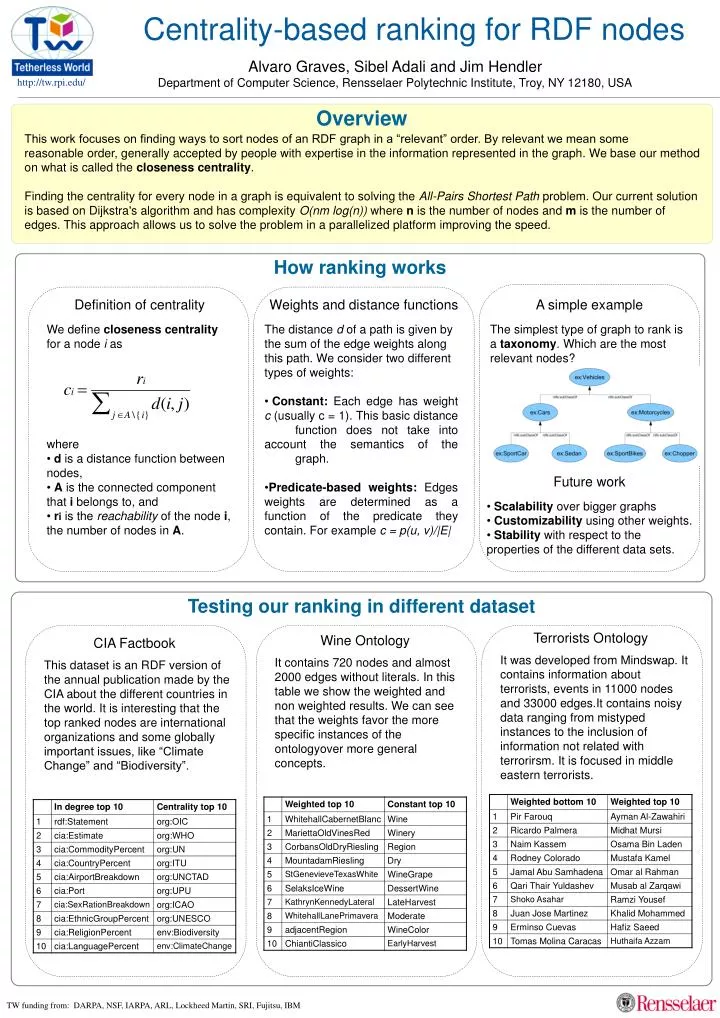
Centrality-based ranking for RDF nodes. Alvaro Graves, Sibel Adali and Jim Hendler Department of Computer Science, Rensselaer Polytechnic Institute, Troy, NY 12180, USA. Overview. This work focuses on finding ways to sort nodes of an RDF graph in a “relevant” order. By relevant we mean some

E N D
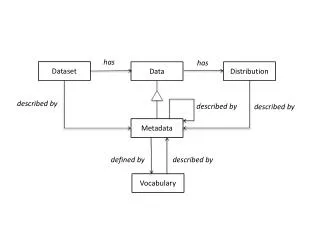
Centrality-based ranking for RDF nodes Alvaro Graves, Sibel Adali and Jim Hendler Department of Computer Science, Rensselaer Polytechnic Institute, Troy, NY 12180, USA Overview This work focuses on finding ways to sort nodes of an RDF graph in a “relevant” order. By relevant we mean some reasonable order, generally accepted by people with expertise in the information represented in the graph. We base our method on what is called the closeness centrality. Finding the centrality for every node in a graph is equivalent to solving the All-Pairs Shortest Path problem. Our current solution is based on Dijkstra's algorithm and has complexity O(nm log(n)) where n is the number of nodes and m is the number of edges. This approach allows us to solve the problem in a parallelized platform improving the speed. How ranking works Definition of centrality Weights and distance functions A simple example • We define closeness centrality for a node i as • where • d is a distance function between nodes, • A is the connected component that i belongs to, and • ri is the reachability of the node i, the number of nodes in A. • The distance d of a path is given by the sum of the edge weights along this path. We consider two different types of weights: • Constant: Each edge has weight c (usually c = 1). This basic distance function does not take into account the semantics of the graph. • Predicate-based weights: Edges weights are determined as a function of the predicate they contain. For example c = p(u, v)/|E| The simplest type of graph to rank is a taxonomy. Which are the most relevant nodes? Future work • Scalability over bigger graphs • Customizability using other weights. • Stability with respect to the properties of the different data sets. Testing our ranking in different dataset Terrorists Ontology Wine Ontology CIA Factbook It was developed from Mindswap. It contains information about terrorists, events in 11000 nodes and 33000 edges.It contains noisy data ranging from mistyped instances to the inclusion of information not related with terrorirsm. It is focused in middle eastern terrorists. It contains 720 nodes and almost 2000 edges without literals. In this table we show the weighted and non weighted results. We can see that the weights favor the more specific instances of the ontologyover more general concepts. This dataset is an RDF version of the annual publication made by the CIA about the different countries in the world. It is interesting that the top ranked nodes are international organizations and some globally important issues, like “Climate Change” and “Biodiversity”. TW funding from: DARPA, NSF, IARPA, ARL, Lockheed Martin, SRI, Fujitsu, IBM