Download
1 / 21
210 likes | 371 Views
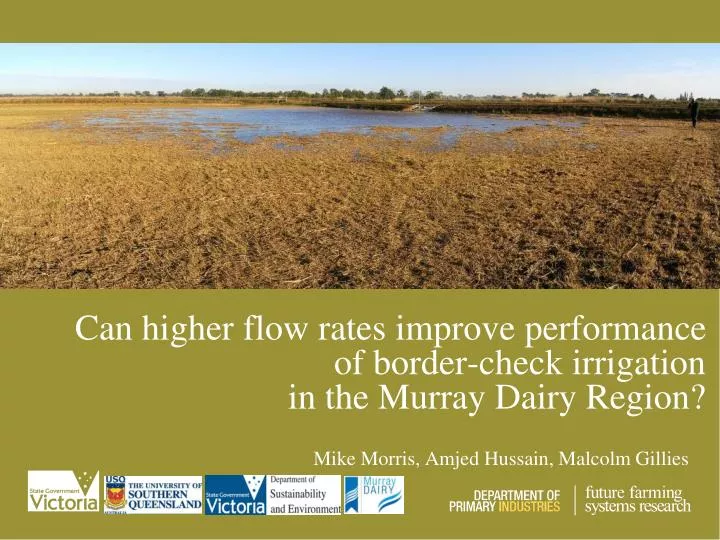
Can higher flow rates improve performance of border-check irrigation in the Murray Dairy Region?. Mike Morris, Amjed Hussain, Malcolm Gillies. The Murray Dairy Region. Image: Murray Dairy. Why fast flow irrigation?. Millennium drought (1997-2009) ↓ dairy irrigators

E N D
Can higher flow rates improve performanceof border-check irrigationin the Murray Dairy Region? Mike Morris, Amjed Hussain, Malcolm Gillies
The Murray Dairy Region • Image: Murray Dairy
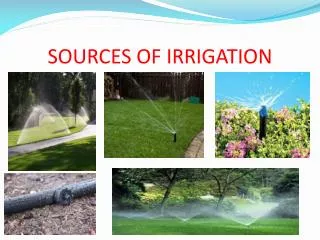
Why fast flow irrigation? • Millennium drought (1997-2009) • ↓ dairy irrigators • ↑ dairy farm system complexity • ↓ time • System modernisation • ↓ outlets • ↑ flow • On-Farm Irrigation Efficiency Program • ↑ ↑ redevelopment
What were the issues? • Industry • Does faster flow save water? • Does it improve productivity? • Catchment managers • Are there catchment scale implications?
What is fast flow? • We have no standard definition • “Fast” is getting faster.. • Our working definition has been • {conventional best practice} x 2
Field measurements • Paired irrigation bays • Managed by the farmer • Monitored for the full irrigation season • Inflow hydrograph • Depth hydrographs • Soil profile water content • Surface drainage • Watertable depth • Productivity
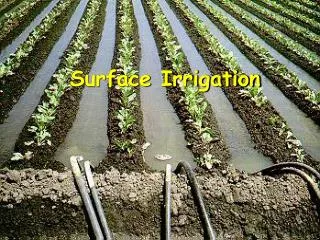
Modelling Surface irrigation models applied to assure process understanding
Light soil site Soil: Cobram loam Bay length: 243 m Bay width: 60 m Slope 1:750 Crop: lucerne (alfalfa) Irrigation flow rates: High flow bay: 0.36 ML/d/m bay width Low flow bay: 0.18 ML/d/m bay width
Heavy soil site Soil: Moira loam Bay length: 200 m Bay width: 40 m Slope 1:650 Crop: perennial pasture Irrigation flow rates: High flow bay = 0.33 ML/d/m bay width Low flow bay = 0.17 ML/d/m bay width
Light soil, lucerne site • High flow provided limited control of infiltrated depth • High flow had greatest runoff variation and losses • Excess water applied can cause substantial deep drainage at both high and low flow rates • Precision of irrigation management was insufficient to capture any potential savings
Heavy soil, pasture site • Very low permeability subsoil • Very slow drainage (~10 hr) • All irrigations replenished soil profile moisture • Minimal impact on soil moisture in subsoil • Advantage of high flow limited to reductions in the duration of irrigations, reducing labour costs
Generalising these results • Analytical Irrigation Model (Austin and Prendergast, 1998) • Kinematic wave assumptions • Linear infiltration function • Monte Carlo analysis (100,000 model realisations) • Flow rate = 0.1 - 0.5 ML/d/m bay width • Cut-off = 20 - 400 mins • Keep “reasonable” irrigations (22,000 model realisations) • Runoff > 0 and < 10% inflow
Bay attributes Length 400 m Width 50 m Slope 1:750 Roughness 0.25 Crack fill 37.5 mm Final infiltration 2 mm/hr
Bay attributes Length 400 m Width 50 m Slope 1:750 Roughness 0.25 Crack fill 37.5 mm Final infiltration 2 mm/hr 154 min 76 min
Bay attributes Length 400 m Width 50 m Slope 1:750 Roughness 0.25 Crack fill 37.5 mm Final infiltration 2 mm/hr 154 ±10 min 76 ± 5 min
Flow rate and irrigation performance • Average infiltrateddepth vs Flow rate • Low quarter uniformity vs Flow rate • for final infiltration from 0.1 to 20 mm/hr • for bay length from 200 to 1000 m
Bay attributes Length 400 m Width 50 m Slope 1:750 Roughness 0.25 Crack fill 37.5 mm Final infiltration 0.1 - 20 mm/hr
Bay attributes Length 400 m Width 50 m Slope 1:750 Roughness 0.25 Crack fill 37.5 mm Final infiltration 0.1 - 20 mm/hr
Bay attributes Length 200 - 1000 m Width 50 m Slope 1:750 Roughness 0.25 Crack fill 37.5 mm Final infiltration 2 mm/hr
Bay attributes Length 200 - 1000 m Width 50 m Slope 1:750 Roughness 0.25 Crack fill 37.5 mm Final infiltration 2 mm/hr
Conclusions • Water savings with high flow rates are not supported by our data or modeling • Were there savings, the irrigation practice on farms measured was not precise enough to capture them • Outcomes were more variable at higher flow rates • We need airbags, not turbo-chargers!