Download
1 / 1
10 likes | 75 Views
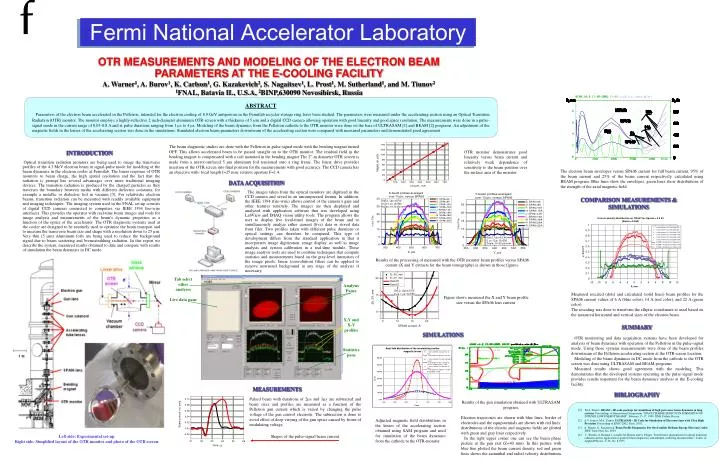
f. Fermi National Accelerator Laboratory. OTR MEASUREMENTS AND MODELING OF THE ELECTRON BEAM PARAMETERS AT THE E-COOLING FACILITY A. Warner 1 , A. Burov 1 , K. Carlson 1 , G. Kazakevich 2 , S. Nagaitsev 1 , L. Prost 1 , M. Sutherland 1 , and M. Tiunov 2

E N D
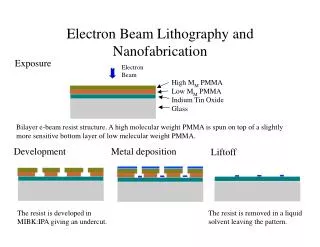
f Fermi National Accelerator Laboratory OTR MEASUREMENTS AND MODELING OF THE ELECTRON BEAM PARAMETERS AT THE E-COOLING FACILITY A. Warner1, A. Burov1, K. Carlson1, G. Kazakevich2, S. Nagaitsev1, L. Prost1, M. Sutherland1, and M. Tiunov2 1FNAL, Batavia IL, U.S.A, 2BINP,630090 Novosibirsk, Russia ABSTRACT Parameters of the electron beam accelerated in the Pelletron, intended for the electron cooling of 8.9 GeV antiprotons in the Fermilab recycler storage ring, have been studied. The parameters were measured under the accelerating section using an Optical Transition Radiation (OTR) monitor. The monitor employs a highly-reflective 2 inch-diameter aluminum OTR-screen with a thickness of 5 µm and a digital CCD camera allowing operation with good linearity and good space resolution. The measurements were done in a pulse-signal mode in the current range of 0.03-0.8 A and at pulse durations ranging from 1 µs to 4 µs. Modeling of the beam dynamics from the Pelletron cathode to the OTR monitor were done on the base of ULTRASAM [1] and BEAM [2] programs. An adjustment of the magnetic fields in the lenses of the accelerating section was done in the simulations. Simulated electron beam parameters downstream of the accelerating section were compared with measured parameters and demonstrated good agreement. The beam diagnostic studies are done with the Pelletron in pulse-signal mode with the bending magnet turned OFF. This allows accelerated beam to be passed straight on to the OTR monitor. The residual field in the bending magnet is compensated with a coil mounted in the bending magnet The 2”-in diameter OTR screen is made from a mirror-surfaced 5 μm aluminum foil tensioned onto a ring frame. The linear drive provides insertion of the OTR screen into final position for the measurements with good accuracy. The CCD camera has an objective with: focal length f=25 mm; relative aperture F=1.4. INTRODUCTION OTR monitor demonstrates good linearity versus beam current and relatively weak dependence of sensitivity to the beam position over the surface area of the monitor. Optical transition radiation monitors are being used to image the transverse profiles of the 4.3 MeV electron beam in signal-pulse mode for modeling of the beam dynamics in the electron cooler at Fermilab. The linear response of OTR monitors to beam charge, the high spatial resolution and the fact that the radiation is prompt has several advantages over more traditional imaging devices. The transition radiation is produced by the charged particles as they traverses the boundary between media with different dielectric constants, for example a metallic or dielectric foil in vacuum [3]. For relativistic electron beams, transition radiation can be measured with readily available equipment and imaging techniques. The imaging system used in the FNAL set-up consists of digital CCD cameras connected to computers via IEEE 1394 fire-wire interfaces. This provides the operator with real-time beam images and tools for image analysis and measurements of the beam’s dynamic properties as a function of the optics of the accelerator. The OTR diagnostic systems used at the cooler are designed to be routinely used to optimize the beam transport and to measure the transverse beam size and shape with a resolution down to 25 µm. Very thin (5 µm) Aluminum foils are being used to reduce the background signal due to beam scattering and bremsstrahlung radiation. In this report we describe the system, measured results obtained to date and compare with results of simulation the beam dynamics in DC mode. The electron beam envelopes versus SPA06 current for full beam current, 95% of the beam current and 25% of the beam current respectively, calculated using BEAM program. Blue lines show the envelopes, green lines show distributions of the strength of the axial magnetic field. DATA ACQUISITION . The images taken from the optical monitors are digitized in the CCD camera and saved in an uncompressed format. In addition, the IEEE 1394 (fire-wire) allows control of the camera’s gain and other features remotely. The images are then displayed and analyzed with application software that was developed using LabView and IMAQ vision utility tools. The program allows the user to display live (real-time) images of the beam and to simultaneously analyze either current (live) data or stored data from files. Two profiles taken with different pulse durations or optical settings can therefore be compared. This type of development differs from the standard application in that it incorporates image digitization, image display, as well as image analysis and system calibration in a real-time module. These image analysis tools are used to combine techniques that compute statistics and measurements based on the gray-level intensities of the image pixels; linear (convolution) filters can be applied to remove unwanted background at any stage of the analysis if necessary. COMPARISON MEASUREMENTS & SIMULATIONS Results of the processing of measured with the OTR monitor beam profiles versus SPA06 current (X and Y extracts for the beam tomography) is shown in those figures. Tab select other analyses Analysis Panes Measured rescaled (dots) and calculated (solid lines) beam profiles for the SPA06 current values of 6 A (blue color), 14 A (red color), and 22 A (green color). The rescaling was done to transform the elliptic coordinates to axial based on the measured horizontal and vertical sizes of the electron beam. Figure shows measured the X and Y beam profile size versus the SPA06 lens current. Live data pane X,Y and X-Y profiles SUMMARY SIMULATIONS OTR monitoring and data acquisition systems have been developed for analysis of beam dynamics with operation of the Pelletron in the pulse-signal mode. Using those systems measurements were done of the beam profiles downstream of the Pelletron accelerating section at the OTR screen location. Modeling of the beam dynamics in DC mode from the cathode to the OTR screen was done using ULTRASAM and BEAM programs. Measured results shows good agreement with the modeling. This demonstrates that the developed systems operating in the pulse-signal mode provides results important for the beam dynamics analysis at the E-cooling facility. Statistics pane MEASUREMENTS BIBLIOGRAPHY Pulsed beam with durations of 2µs and 1µs are subtracted and beam sizes and profiles are measured as a function of the Pelletron gun current which is varied by changing the pulse voltage of the gun control electrode. The subtraction is done to avoid effect of deep varying of the gun optics caused by fronts of modulating voltage. Results of the gun simulation obtained with ULTRASAM program. Electron trajectories are shown with blue lines; border of electrodes and the equipotentials are shown with red lines; distributions of the electric and magnetic fields are plotted with green and gray lines respectively. In the right upper corner one can see the beam phase picture at the gun exit (Z=40 mm). In this picture with blue line plotted the beam current density, red and green lines shows the azimuthal and radial velocity distributions. [1] M.A. Tiunov. BEAM 2D-code package for simulation of high perveance beam dynamics in long systems. Proceedings of International Symposium "SPACE CHARGE EFFECTS IN FORMATION OF INTENSE LOW ENERGY BEAMS". February 15-17, 1999, JINR, Dubna, Russia. [2] A.V. Ivanov, M.A. Tiunov. ULTRASAM - 2D Code for Simulation of Electron Guns with Ultra High Precision. Proceeding of EPAC-2002, Paris, 2002. [3] A. Warner, G. Kazakevich. Beam Profile Diagnostics For the fermilab Medium Energy Electron Cooler. IEEE Trans.Nucl.Sci, 2004. [4] L. Wartski, S. Roland, J. Lasalle, M. Bolore and G. Filippi, “Interference phenomenon in optical transition radiation and its application to particle beam diagnostics and multiple-scattering measurements”, Journ. of Applied Physics, V. 46, No. 8,1975. Adjusted magnetic field distributions in the lenses of the accelerating section obtained using SAM program and used for simulation of the beam dynamics from the cathode to the OTR-monitor. Left side: Experimental set-up. Right side: Simplified layout of the OTR monitor and photo of the OTR screen. Shapes of the pulse-signal beam current.