Download

1 / 43
430 likes | 555 Views
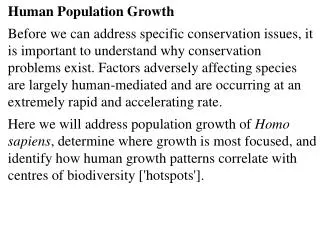
Human Population Growth and Natural Capital Review. Crude Birth Rate : the annual number of live births per 1000 people Crude Death Rate : the annual number of deaths per 1000 people

E N D
Crude Birth Rate: the annual number of live births per 1000 people • Crude Death Rate: the annual number of deaths per 1000 people • Total Fertility Rate: The average number of children that would be born to each woman if, during her childbearing years, she bore children at the current year’s rate for women that age. • Natural Increase: The growth of a population, birth minus death = Natural Increase. Excludes effects of migration. • Replacement Value: The number of children per family just sufficient to keep total population constant. 2.1
World population has been growing exponentially and is continuing to grow. 2000 6 billion 2013 7 billion 2028 8 billion 2054 9 billion Source: The Population Reference Bureau, 2001 World Population Explosion
World Population Cartogram Fig. 2-1: This cartogram displays countries by the size of their population rather than their land area.(Only countries with 50 million or more people are named.)
Population Distribution Source: Bergman and Renwick, 2003
Population Changes (Source: US Census International Data Base
Case Studies Transition: Bolivia and Haiti is entering the third stage of demographic transition. Characteristics of the countries: young population, low educational attainment, and low urbanization.
Case Studies Moderate Transition: El Salvador, Guatemala, Honduras, Nicaragua and Paraguay. Experienced some mortality decline but high fertility.
Case Studies • Transition in Progress:Brazil, Colombia, Costa Rica, Ecuador, Mexico, Panama, Peru, Dominican Republic, and Venezuela. • Natural increase is declining due to the highly urban and young population having lower fertility levels. • Ex. Fertility declining from 6.3 children in 1965 to 2.8 per woman in 1990.
Case Studies Advanced Transition: Cuba, Argentina, Chile and Uruguay. Life expectancy highest in L.A., below level in most demographic categories
World Population Growth1950–2000 Fig. 2-6: Total world population increased from 2.5 to 6 billion in this half century. The natural increase rate peaked in the early 1960s and has declined since, but the number of people added each year did not peak until 1990.
Moderate Growth in Chile Fig. 2-18: Chile entered stage 2 of the demographic transition in the 1930s, and it entered stage 3 in the 1960s.
Demographic Transition 1st Stage (1850-1880): Characteristic of traditional agrarian societies, birth rates and death rates are high, little net population. 2nd Stage (1880-1960): death rates began declining as health and standard of living increased. The population growth rates began increasing. 3rd Stage (1960-present?): When birth decline associated with urbanization and economic change resulting in population growth declines. 4th Stage: Population experiences low birth rates, low death rates, and low rates of natural increase. In some cases population declines.
The Demographic Transition Fig. 2-13: The demographic transition consists of four stages, which move from high birth and death rates, to declines first in death rates then in birth rate, and finally to a stage of low birth and death rates. Population growth is most rapid in the second stage.
Human Development Index (HDI) • The classification system used by the World Bank. Its annual development reports changed from mode of production (industrial) to income-based classification in 1980s. • The United Nations uses a weighted statistical formula to compare quality of life among countries called Human Development Index (HDI). • It measures purchasing power, life expectancy, adult literacy, and other measures
Human Development Index Fig. 9-1: Developed by the United Nations, the HDI combines several measures of development: life expectancy at birth, adjusted GDP per capita, and knowledge (schooling and literacy).
Life Expectancy at Birth Fig. 2-11: Life expectancy at birth is the average number of years a newborn infant can expect to live. The highest life expectancies are generally in the wealthiest countries, and the lowest in the poorest countries.
Infant Mortality Rates Fig. 2-10: The infant mortality rate is the number of infant deaths per 1,000 live births per year. The highest infant mortality rates are found in some of the poorest countries of Africa and Asia.
Crude Death Rates Fig. 2-12: The crude death rate (CDR) is the total number of deaths in a country per 1,000 population per year. Because wealthy countries are in a late stage of the demographic transition, they often have a higher CDR than poorer countries.
Total Fertility Rates Fig. 2-9: The Total fertility rate (TFR) is the number of children an average woman in a society will have through her childbearing years. The lowest rates are in Europe, and the highest are in Africa and parts of the Middle East.
Population Doubling Time • Why is it important? If the doubling time is fast, then the country needs to prepare for the needs of a growing populations • Use the “Rule of 70 (72)” 70/NIR = doubling time in years
Finding Doubling Time • The time it takes for a population to double. Doubling time = 72/NIR • If the growth rate is 2.3, what is the doubling time? 30 years • If the growth rate is 6.2, what is the doubling time? 11 years • The Higher the Growth Rate, The _____ the time period it takes for the population to double
Doubling Time Facts • In 1970 there were 3.7 billion people. • Today there are 7 billion people. • The worlds’ rate of growth is 1.1% per year. • Population is doubling every 60 years
Natural Increase Rates Fig. 2-7:The natural increase rate (NIR) is the percentage growth or decline in the population of a country per year (not including net migration). Countries in Africa and Southwest Asia have the highest current rates, while Russia and some European countries have negative rates.
Natural Increase Rate Calculation NIR = CBR - CDR 10 So, country X has CBR = 26 and CDR = 16 The NIR is (26-26)/10 = 1%
Percent of Population under 15 Fig. 2-15: About one-third of world population is under 15, but the percentage by country varies from over 40% in most of Africa and some Asian countries, to under 20% in much of Europe.
HIV/AIDS Prevalence Rates, 2002 Fig. 2-26: The highest HIV infection rates are in sub-Saharan Africa. India and China have large numbers of cases, but lower infection rates at present.
Use of Family Planning Fig. 2-22: Both the extent of family planning use and the methods used vary widely by country and culture.
Trends in Aging, by World Region Population Ages 65 and Older Percent Source: United Nations, World Population Prospects: The 2002 Revision (medium scenario), 2003.
Factors that slow population growth:Economic SecurityFemale literacyGood medical careOpportunity for womenEducation Contraception and family planning
Natural Capital vs IncomeNatural Capital is the stock and natural income is the harvest. Natural income can be economic, intrinsic, scientific and ecological.
Sustainable YieldThe natural capital must be used in a way which does not damage or degrade the resource for future generations.
Sustainable developmentIncludes social, economic and environmental interests.
Renewable natural capital grows using solar energy and photosynthesis or as part of a food chain.Forests: Logging must be done carefully to avoid erosion of soil.Grazing: Careful management avoids over grazingFisheries: Avoid over fishing and polluting the water
Replenishable natural capital is nonliving but uses solar energy to drive the process.Water resources must be used carefully to avoid waste during irrigation, leaky pipes and pollutionThe ozone layer replenishes if CFC’s are not used.
Nonrenewable natural capital does not regenerate within a human timescaleMinerals and metals must be recycled to avoid depletion of these resourcesFossil fuels and uranium are nonrenewable energy resources
Additional Resources Human Development Index 2001 http://www.undp.org/hdr2001/indicator/index.html World Population Pyramid http://www.census.gov/ipc/www/idbpyr.html