Download
1 / 1
10 likes | 128 Views
Flood Mapping and Sediment Transport in Otsego County Streams, New York. By Les Hasbargen, Tyson Robb, Anthony Grimes, and Roy Widrig Earth Sciences Department, SUNY Oneonta. Overview

E N D
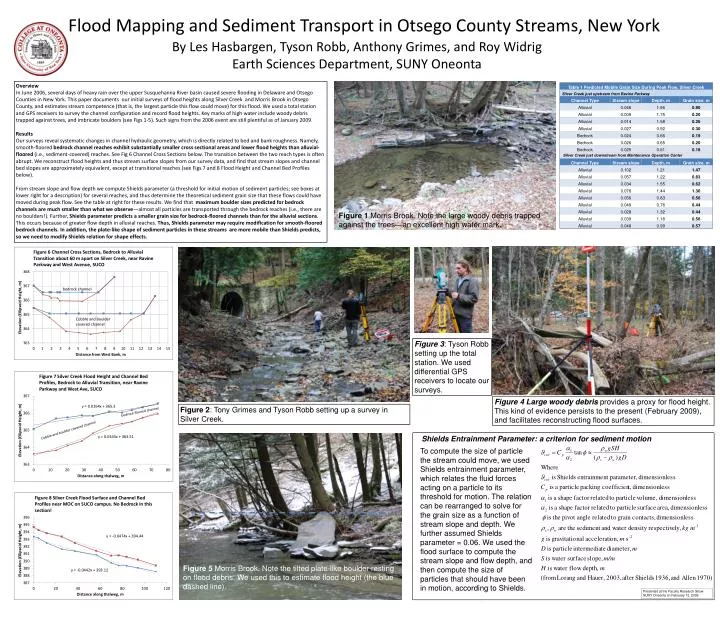
Flood Mapping and Sediment Transport in Otsego County Streams, New York By Les Hasbargen, Tyson Robb, Anthony Grimes, and Roy Widrig Earth Sciences Department, SUNY Oneonta Overview In June 2006, several days of heavy rain over the upper Susquehanna River basin caused severe flooding in Delaware and Otsego Counties in New York. This paper documents our initial surveys of flood heights along Silver Creek and Morris Brook in Otsego County, and estimates stream competence (that is, the largest particle this flow could move) for this flood. We used a total station and GPS receivers to survey the channel configuration and record flood heights. Key marks of high water include woody debris trapped against trees, and imbricate boulders (see Figs 1-5). Such signs from the 2006 event are still plentiful as of January 2009. Results Our surveys reveal systematic changes in channel hydraulic geometry, which is directly related to bed and bank roughness. Namely, smooth-floored bedrock channel reaches exhibit substantially smaller cross sectional areas and lower flood heights than alluvial-floored (i.e., sediment-covered) reaches. See Fig 6 Channel Cross Sections below. The transition between the two reach types is often abrupt. We reconstruct flood heights and thus stream surface slopes from our survey data, and find that stream slopes and channel bed slopes are approximately equivalent, except at transitional reaches (see Figs 7 and 8 Flood Height and Channel Bed Profiles below). From stream slope and flow depth we compute Shields parameter (a threshold for initial motion of sediment particles; see boxes at lower right for a description) for several reaches, and thus determine the theoretical sediment grain size that these flows could have moved during peak flow. See the table at right for these results. We find that maximum boulder sizes predicted for bedrock channels are much smaller than what we observe—almost all particles are transported through the bedrock reaches (i.e., there are no boulders!). Further, Shields parameter predicts a smaller grain size for bedrock-floored channels than for the alluvial sections. This occurs because of greater flow depth in alluvial reaches. Thus, Shields parameter may require modification for smooth-floored bedrock channels. In addition, the plate-like shape of sediment particles in these streams are more mobile than Shields predicts, so we need to modify Shields relation for shape effects. Figure 1 Morris Brook. Note the large woody debris trapped against the trees—an excellent high water mark. Figure 3: Tyson Robb setting up the total station. We used differential GPS receivers to locate our surveys. Figure 4 Large woody debris provides a proxy for flood height. This kind of evidence persists to the present (February 2009), and facilitates reconstructing flood surfaces. Figure 2: Tony Grimes and Tyson Robb setting up a survey in Silver Creek. Shields Entrainment Parameter: a criterion for sediment motion To compute the size of particle the stream could move, we used Shields entrainment parameter, which relates the fluid forces acting on a particle to its threshold for motion. The relation can be rearranged to solve for the grain size as a function of stream slope and depth. We further assumed Shields parameter = 0.06. We used the flood surface to compute the stream slope and flow depth, and then compute the size of particles that should have been in motion, according to Shields. Figure 5 Morris Brook. Note the tilted plate-like boulder resting on flood debris. We used this to estimate flood height (the blue dashed line). Presented at the Faculty Research Show SUNY Oneonta on February 12, 2009