Download
1 / 34
340 likes | 470 Views
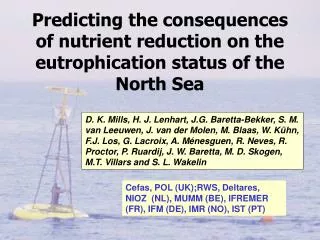
Trans-boundary nutrient transport in the North Sea using POLCOMS-ERSEM. Sarah Wakelin (POL) Jason Holt (POL) Roger Proctor + ERSEM development from PML. Overview. POLCOMS-ERSEM The Atlantic Margin implementation for trans-boundary nutrient calculations Validation

E N D
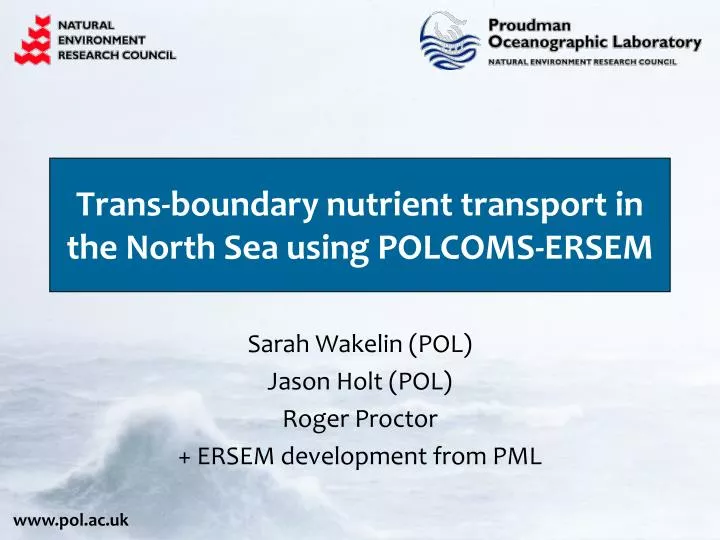
Trans-boundary nutrient transport in the North Sea using POLCOMS-ERSEM Sarah Wakelin (POL) Jason Holt (POL) Roger Proctor + ERSEM development from PML
Overview • POLCOMS-ERSEM • The Atlantic Margin implementation for trans-boundary nutrient calculations • Validation • Transboundary nutrient transports
POLCOMS • 3D baroclinic B-grid model • primitive equation • finite differences • spherical polar grid with vertical s-coordinate
POLCOM Model Domains Atlantic Margin 1/6ox1/9o Medium resolution continental shelf 1/10ox1/15o High resolution continental shelf 1/40ox1/60o S. North Sea 1/40ox1/60o Liverpool Bay 1/400ox1/600o Irish Sea 1/40ox1/60o GCOMS – Global Coastal Ocean Modelling
Using Ocean Colour EO to improve the model • Focuses on a problem area (SPM modelling difficult, CDOM modelling not well established) • Use ocean colour products to estimate SPM+CDOM • Constrain light field • Avoids complex dependencies within the model • Simple to implement
An (simple) assimilative attenuation model Diffuse attenuation of PAR: pure water SeaWiFs (non-biotic) model • A variable for non-biotic absorption is: • Advected-diffused (to give memory) • Relaxed to surface observations throughout the depth log10(m-1) Non-biotic absorption 8-day mean (May)
The Atlantic Margin Model (AMM) simulation • ~12 km resolution, 42 vertical s-levels • 1996 spinup using initial condition from model run starting in 1960 • 6 year run (1997-2002) • ERA40 + operational ECMWF surface forcing • 249 river flows • nitrate • ammonium • silicate • phosphate • 15 tidal constituents • Ocean boundaries from global implementation of ORCA (Smith and Haines, 2009) • EO SPM/CDOM attenuation – mean annual cycle
Surface temperature • Pathfinder AVHRR sea surface temperature 9km-resolution data
Surface salinity winter 2002 summer 2002
Surface currents annual mean surface current 2002 (m/s) Turrell (1992)
Net Primary Production Net primary production 2002 (gC m-2yr-1) Obs: Joint and Pomeroy (1993) SeaWiFS in the Celtic Sea for 2002 265±26 gC m-2yr-1 (T. Smyth)
Ecosystem validation correlation coefficients
Proudman Oceanographic LaboratoryJoseph Proudman Building6 Brownlow Street, Liverpool L3 5DA UKslwa@pol.ac.uk