1 / 42

These Graphs Represent

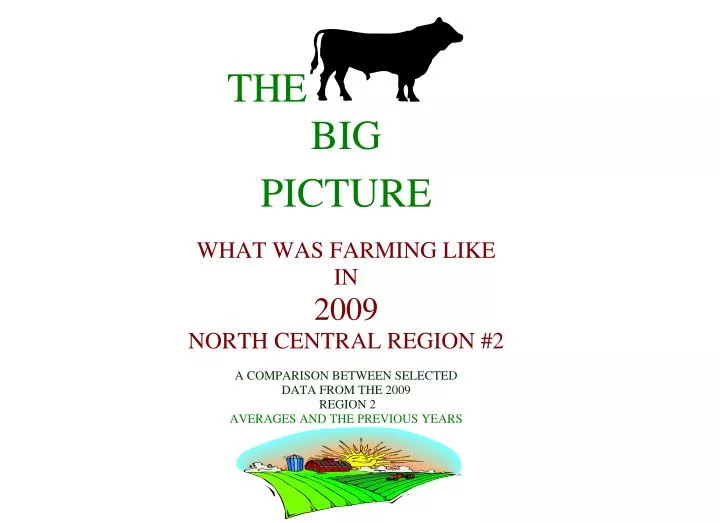
These Graphs Represent. An Average of Detailed Records of Farms Enrolled in Farm Management Programs located in North Central North Dakota (Region 2) and for years 1989-2009. North Dakota Farm Business Management Education Programs North Central North Dakota (Region 2) Averages.

chad
Download Presentation

These Graphs Represent

An Image/Link below is provided (as is) to download presentation Download Policy: Content on the Website is provided to you AS IS for your information and personal use and may not be sold / licensed / shared on other websites without getting consent from its author. Content is provided to you AS IS for your information and personal use only. Download presentation by click this link. While downloading, if for some reason you are not able to download a presentation, the publisher may have deleted the file from their server. During download, if you can't get a presentation, the file might be deleted by the publisher.

E N D

Presentation Transcript


  1. These Graphs Represent An Average of Detailed Records of Farms Enrolled in Farm Management Programs located in North Central North Dakota (Region 2) and for years 1989-2009

  2. North Dakota Farm Business Management Education Programs North Central North Dakota (Region 2) Averages

  3. Gross Cash Farm IncomeRegion 2 Farm Business Mgmt.

  4. Cash Operation Expense & Deprec Region 2 Farm Business Mgmt.

  5. Net Farm IncomeRegion 2 Farm Business Mgmt.

  6. Net Farm Income (Low & High 20%)Region 2 Farm Business Mgmt.

  7. Total Insurance IncomeRegion 2 Farm Business Mgmt.

  8. Net Farm IncomewithoutInsurance Income Region 2 Farm Business Mgmt.

  9. Total Government Payments (Cash) Region 2 Farm Business Mgmt.

  10. Net Farm Income without Gov PaymentsRegion 2 Farm Business Mgmt.

  11. Net Farm Income without Gov Pay or Ins IncomeRegion 2 Farm Business Mgmt.

  12. Government Payments as a Percent of All ExpenseRegion 2 Farm Business Mgmt.

  13. Average Total AssetsRegion 2 Farm Business Mgmt.

  14. Average Total LiabilitiesRegion 2 Farm Business Mgmt.

  15. Average Change in Net WorthRegion 2 Farm Business Mgmt.

  16. Total Acres FarmedRegion 2 Farm Business Mgmt.

  17. Total Net IncomeRegion 2 Farm Business Mgmt.

  18. Labor & Management EarningsRegion 2 Farm Business Mgmt.

  19. Labor & Management Earningswithout Government PaymentsRegion 2 Farm Business Mgmt.

  20. Total Seed ExpenseRegion 2 Farm Business Mgmt.

  21. Total Fertilizer ExpenseRegion 2 Farm Business Mgmt.

  22. Total Chemical ExpenseRegion 2 Farm Business Mgmt.

  23. Total Crop Insurance ExpenseRegion 2 Farm Business Mgmt.

  24. Total Repair ExpenseRegion 2 Farm Business Mgmt.

  25. Total Fuel & Oil ExpenseRegion 2 Farm Business Mgmt.

  26. Total Money BorrowedRegion 2 Farm Business Mgmt.

  27. Total Interest PaidRegion 2 Farm Business Mgmt.

  28. Total Family Living ExpenseRegion 2 Farm Business Mgmt.

  29. % Return on Equity per FarmRegion 2 ND Farm Business Management

  30. % Return on Assets per FarmRegion 2 ND Farm Business Management

  31. % Return on Equity/Assets per FarmRegion 2,ND Farm Business Mgmt.

  32. % Return on Assets/Equity per FarmRegion 2,ND Farm Business Mgmt.

  33. Average Farmer AgeRegion 2 Farm Business Mgmt.

  34. Wheat & Barley YieldsRegion 2,ND Farm Business Mgmt.

  35. Average Wheat PriceRegion 2 Farm Business Mgmt.

  36. Net Income Per CowRegion 2 Farm Business Mgmt.

  37. Total Direct & Overhead Costs/CowRegion 2 Farm Business Mgmt.

  38. Selected Annual Farm ExpensesRegion 2 Farm Business Mgmt.(North Central North Dakota)

  39. Net Farm IncomeRegion 2 Farm Business Mgmt.(North Central North Dakota)

  40. Annual Fertilizer & Fuel ExpensesRegion 2 Farm Business Mgmt.(North Central North Dakota)

  41. An Educational Program of the North Dakota State Department for Career and Technical Education

More Related