Download
1 / 28
290 likes | 476 Views
Testing the LibQUAL+ Survey Instrument. James Shedlock, AMLS, Dir. Linda Walton, MLS, Assoc. Dir. Galter Health Sciences Library Northwestern University. Testing the LibQUAL+ Survey Instrument. A presentation for the Midwest Chapter-Medical Library Association Annual Meeting

E N D
Testing the LibQUAL+ Survey Instrument James Shedlock, AMLS, Dir. Linda Walton, MLS, Assoc. Dir. Galter Health Sciences Library Northwestern University
Testing the LibQUAL+ Survey Instrument A presentation for the Midwest Chapter-Medical Library AssociationAnnual Meeting Minneapolis, Minnesota Sept. 27-Oct. 1, 2002
Goals • To introduce the LibQUAL+ survey as a tool for measuring the quality of library service • To demonstrate application of LibQUAL+ in an academic health sciences library • To show how LibQUAL+ results can be used
Outline • Background • Participating in LibQUAL+, 2001 and 2002 • Results • Discussion • Conclusion • Reference … for further reading
Background: LibQUAL+ • What is LibQUAL+
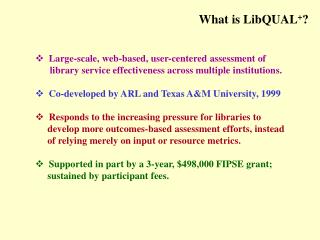
Background: LibQUAL+ • LibQUAL+ is a survey instrument first developed at Texas A&M University Libraries, now supported by Dept. of Education grants in collaboration with the Association of Research Libraries (ARL).
Background: LibQUAL+ • LibQUAL+ derives from the SERVQUAL instrument, tested in several business industries, and proven to work. • SERVQUAL theory: • “Only users can determine quality.” • Quality measured in gaps, between minimum expectations and perceived service • LibQUAL+ has undergone several tests to refine the tool for accuracy. • The 2002 test involved 128 U.S. libraries and 78,000 participants.
Background: LibQUAL+ • LibQUAL+ currently tests for quality in four dimensions (2002 test): access to info, personal control, library as place, affect of service. • LibQUAL+ employs three levels of user response: minimum, desired and perceived service levels. • LibQUAL+ uses a nine-point scale, measuring low to high.
Background: Galter Library • Galter Library (GHSL) participated in the 2001 and 2002 tests. • GHSL was only stand-alone academic medical library in 2001 test; no true peer group for benchmarks. • GHSL among 36 academic medical libraries in the 2002 test (supported by NLM, AAHSL and individual libraries).
Background: Galter Library • Motivation for participating in LibQUAL+: • Evaluating services part of strategic plan • Easy way to meet goals, learn more about users • Wanted to be on the cutting edge for measuring quality • As AAHSL Annual Stats editor, needed to learn how to measure quality • Relatively low cost
Participating in LibQUAL+ • Fully web automated • Reliance on email communication • Need access to users email addresses; use bulk mail, lists, listservs, etc. • Consider all users or a sample • At Galter, all users with email known to med school were solicited.
Participating in LibQUAL+ • Sample questions … • Complete run of journals; Comprehensive print collections; Enabling website; Comfortable, inviting location; Willingness to help; Consistently courteous • 5 special questions in 2002 for AAHSL libraries • “When it comes to … [complete runs of journal titles] … my minimum service level is … my desired service level is … perceived service performance is …
When it comes to… My Minimum Service Level Is low high My Desired Service Level Is low high Perceived Service Performance Is low high N/A 1) Willingness to help users 1 2 3 4 5 6 7 8 9 1 2 3 4 5 6 7 8 9 1 2 3 4 5 6 7 8 9 N/A 2) Space that facilitates quiet study 1 2 3 4 5 6 7 8 9 1 2 3 4 5 6 7 8 9 1 2 3 4 5 6 7 8 9 N/A 3) Complete runs of journal titles 1 2 3 4 5 6 7 8 9 1 2 3 4 5 6 7 8 9 1 2 3 4 5 6 7 8 9 N/A Results • See sample web form:
Results • Scoring • Average scores for each question, for each user group, for each parameter (minimum, desired, perceived) • Gap scores = perceived – minimum • Graphs • Radar graphs – shows total results, by aggregate and group • Zone of tolerance – shows dimensions • General satisfaction • Percentile within normative group
Results • Participation: • 2001 • 3,575 surveys sent • 476 responses • 13.3% return rate • 2002 • 3,819 surveys sent • 457 responses • 12% return rate
Results • Age, gender changed little from 2001 to 2002 results • Group participation …
Results • Aggregate – sample gap scores: • 2001 • Negative gaps • Comprehensive print collections: -0.21 • Complete run of journals: -0.31 • Convenient business hours: -0.35 • Positive gaps • Attractive facility: 2.21 • Employees who enjoy what they do: 1.41 • Library focus on here and now: 1.38
Results • Sample score: • 2001 • Comprehensive print collections • Minimum score: 6.45 • Desired: 7.92 • Perceived: 6.25 • 6.25 – 6.45 = -0.20
Results • Aggregate – sample gap scores: • 2002 • Negative gaps • Complete run of journals: -0.36 • Convenient business hours: -0.68 • Making e-resources accessible: -0.09 • Positive gaps • Comfortable, inviting location: 0.74 • [staff] willingness to help users: 0.66 • [staff] giving uses individual attention: 0.65
Results • User group summary for 2002: • Faculty • Timely document delivery: -0.01 • Interdisciplinary needs: -0.05 • Comfortable, inviting location: 1.09 • Contemplative environment: 0.89 • Employees who instill confidence: 0.86
Results • User group summary for 2002: • Staff • No negative scores • Comfortable, inviting location: 1.64 • Convenient access to collections: 1.18 • Contemplative environment: 1.10
Results • User group summary for 2002: • Students • Convenient business hours: -1.80 • Space facilitating quiet study: -0.51 • Complete run of journals: -0.32 • Place for reflection, creativity: 0.65 • Willingness to help users: 0.61 • Comfortable, inviting location: 0.50
Discussion • Learn what to fix! • These are the users’ issues with the library – listen to them, even if you disagree. “The customer is always right!” • Good insight for very little effort. • Do once a year, notice change in scores.
Discussion • Follow-up: use gap scores in conjunction with other data. Gap scores are but one piece of data for evaluating library services. • Study users’ comments (new in 2002). • Review AAHSL Annual Stats for quantitative data, benchmarks • Consider using focus groups to listen to users; e.g., ask faculty how they interpret LibQUAL+ questions • What do your users think about quality?
Conclusion • Incorporate into strategic plan • Easy to do • Considering a third survey if we can make change happen • Potential to be a powerful tool for the library profession, especially in time of change • Future: under consideration at ARL
Reference • For more information about LibQUAL+, see: www.arl.org/libqual Look closely at About(FAQs)and Publications(bibliography).