Download
1 / 1
20 likes | 144 Views
Comparing Eye Movements Sampled At Different Rates. Andrew D. Ouzts, Andrew T. Duchowski SCHOOL OF COMPUTING, CLEMSON UNIVERSITY aouzts@g.clemson.edu duchowski@acm.org. Abstract. Methodology.

E N D
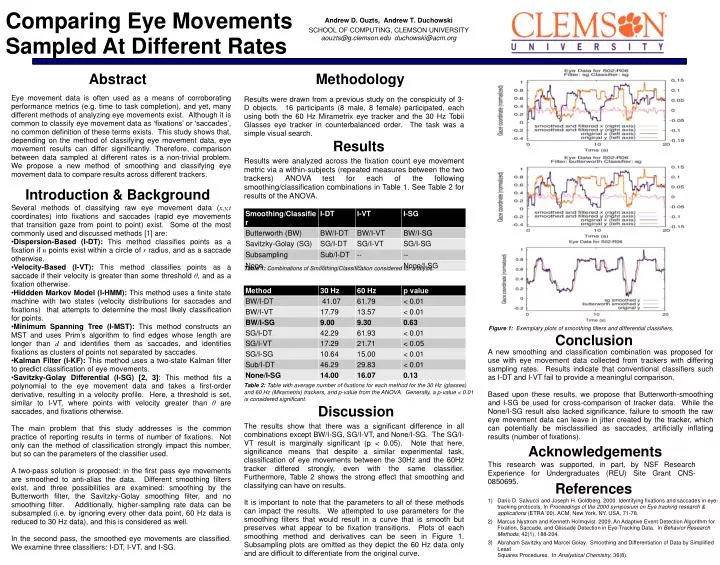
Comparing Eye Movements Sampled At Different Rates Andrew D. Ouzts, Andrew T. Duchowski SCHOOL OF COMPUTING, CLEMSON UNIVERSITYaouzts@g.clemson.edu duchowski@acm.org Abstract Methodology Eye movement data is often used as a means of corroborating performance metrics (e.g. time to task completion), and yet, many different methods of analyzing eye movements exist. Although it is common to classify eye movement data as ‘fixations’ or ‘saccades’, no common definition of these terms exists. This study shows that, depending on the method of classifying eye movement data, eye movement results can differ significantly. Therefore, comparison between data sampled at different rates is a non-trivial problem. We propose a new method of smoothing and classifying eye movement data to compare results across different trackers. • Results were drawn from a previous study on the conspicuity of 3-D objects. 16 participants (8 male, 8 female) participated, each using both the 60 Hz Mirametrix eye tracker and the 30 Hz Tobii Glasses eye tracker in counterbalanced order. The task was a simple visual search. Results • Results were analyzed across the fixation count eye movement metric via a within-subjects (repeated measures between the two trackers) ANOVA test for each of the following smoothing/classification combinations in Table 1. See Table 2 for results of the ANOVA. Introduction & Background Several methods of classifying raw eye movement data (x,y,t coordinates) into fixations and saccades (rapid eye movements that transition gaze from point to point) exist. Some of the most commonly used and discussed methods [1] are: • Dispersion-Based (I-DT): This method classifies points as a fixation if npoints exist within a circle of r radius, and as a saccade otherwise. • Velocity-Based (I-VT): This method classifies points as a saccade if their velocity is greater than some threshold θ, and as a fixation otherwise. • Hiddden Markov Model (I-HMM): This method uses a finite state machine with two states (velocity distributions for saccades and fixations) that attempts to determine the most likely classification for points. • Minimum Spanning Tree (I-MST): This method constructs an MST and uses Prim’s algorithm to find edges whose length are longer than dand identifies them as saccades, and identifies fixations as clusters of points not separated by saccades. • Kalman Filter (I-KF): This method uses a two-state Kalman filter to predict classification of eye movements. • Savitzky-Golay Differential (I-SG) [2, 3]: This method fits a polynomial to the eye movement data and takes a first-order derivative, resulting in a velocity profile. Here, a threshold is set, similar to I-VT, where points with velocity greater than θ are saccades, and fixations otherwise. • The main problem that this study addresses is the common practice of reporting results in terms of number of fixations. Not only can the method of classification strongly impact this number, but so can the parameters of the classifier used. • A two-pass solution is proposed: in the first pass eye movements are smoothed to anti-alias the data. Different smoothing filters exist, and three possibilities are examined: smoothing by the Butterworth filter, the Savitzky-Golay smoothing filter, and no smoothing filter. Additionally, higher-sampling rate data can be subsampled (i.e. by ignoring every other data point, 60 Hz data is reduced to 30 Hz data), and this is considered as well. • In the second pass, the smoothed eye movements are classified. We examine three classifiers: I-DT, I-VT, and I-SG. Table 1: Combinations of Smoothing/Classification considered for analysis. Figure 1: Exemplary plots of smoothing filters and differential classifiers. Conclusion • A new smoothing and classification combination was proposed for use with eye movement data collected from trackers with differing sampling rates. Results indicate that conventional classifiers such as I-DT and I-VT fail to provide a meaningful comparison. • Based upon these results, we propose that Butterworth-smoothing and I-SG be used for cross-comparison of tracker data. While the None/I-SG result also lacked significance, failure to smooth the raw eye movement data can leave in jitter created by the tracker, which can potentially be misclassified as saccades, artificially inflating results (number of fixations). Table 2: Table with average number of fixations for each method for the 30 Hz (glasses) and 60 Hz (Mirametrix) trackers, and p-value from the ANOVA. Generally, a p-value < 0.01 is considered significant. Discussion • The results show that there was a significant difference in all combinations except BW/I-SG, SG/I-VT, and None/I-SG. The SG/I-VT result is marginally significant (p < 0.05). Note that here, significance means that despite a similar experimental task, classification of eye movements between the 30Hz and the 60Hz tracker differed strongly, even with the same classifier. Furthermore, Table 2 shows the strong effect that smoothing and classifying can have on results. • It is important to note that the parameters to all of these methods can impact the results. We attempted to use parameters for the smoothing filters that would result in a curve that is smooth but preserves what appear to be fixation transitions. Plots of each smoothing method and derivatives can be seen in Figure 1. Subsampling plots are omitted as they depict the 60 Hz data only and are difficult to differentiate from the original curve. Acknowledgements This research was supported, in part, by NSF Research Experience for Undergraduates (REU) Site Grant CNS-0850695. References • Dario D. Salvucci and Joseph H. Goldberg. 2000. Identifying fixations and saccades in eye-tracking protocols. In Proceedings of the 2000 symposium on Eye tracking research & applications (ETRA '00). ACM, New York, NY, USA, 71-78. • Marcus Nystrom and Kenneth Holmqvist. 2009. An Adaptive Event Detection Algorithm for Fixation, Saccade, and Glissade Detection in Eye-Tracking Data. In Behavior Research Methods, 42(1), 188-204. • Abraham Savitzky and Marcel Golay. Smoothing and Differentiation of Data by Simplified LeastSquares Procedures. In Analystical Chemistry, 36(8).