Download
1 / 38
380 likes | 389 Views
A Look at Heart Failure based on the Study of End-Systolic Pressure-Volume Relation (ESPVR). Rachad M. Shoucri Department of Mathematics and Computer Science Royal Military College of Canada Kingston, Ontario, Canada K7K 7B4. a: Atrial Contraction. b: Isovolumetric Contraction.

E N D
A Look at Heart Failure based on the Study of End-Systolic Pressure-Volume Relation (ESPVR) Rachad M. Shoucri Department of Mathematics and Computer ScienceRoyal Military College of CanadaKingston, Ontario, Canada K7K 7B4
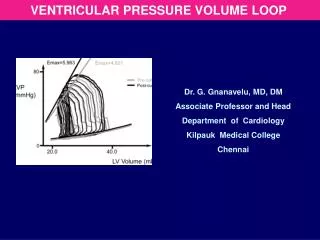
a: Atrial Contraction b: IsovolumetricContraction c: Ejection d: Isovolumetric Relaxation Richard E. Klabunde: Cardiovascular PhysiologyConcepts http://www.cvphysiology.com/HeartDisease/HD002a.htm
Non-Linear ESPVR, Frank-Starling Mechanism ESPVR Nishioka O. et al, Jpn Heart J 29(5), 705 (1988)
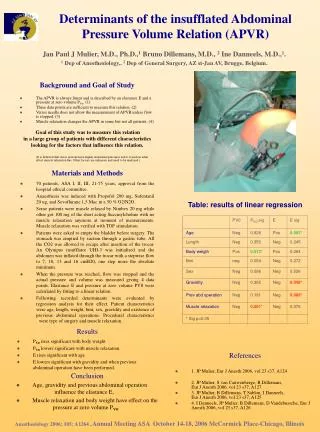
The radial equation of equilibrium :ab D(r)dr = Dh = Piso, by the mean value theorem Equilibrium of pressure forces on the endocardium Dh - P = E (Ved - V) it can be split as follows P = E (V - Vd) Dh = Piso = E (Ved - Vd) near end-systole (Dh)m - Pm = Emax (Ved - Vm) Pisom – Pm = Emax SV Shoucri, Am. J. Physiol. 260, H282 (1991)
The physiological state of the heart and the ESPVR normal physiological state Emax/eam 2 (point d1) SV > (Ved – Vom)/2 Vom < (Ved + Vom)/2 mildly depressed state Emax/eam 1 (point d5) severly depressed state Emax/eam 1 (d1 above d5) -------------------------------------------- stroke work= Pm ( Ved - Vm) = SW stroke work reserve = SWR = (SW)max - SW Emax = max. ventricular elastance eam = arterial elastance
Ventriculo-arterial coupling and the areas under ESPVR Experimental Theoretical Shoucri, Jpn Heart J, 35, 771 (1994) Experimental data from Borow et al, Circulation 65, 988 (1982)
Physiological state of the heartExperimental result NORMAL MILDLY DEPRESSED Burkhoff et al, Am. J. Physiol. 250, R1021 (1986) Burkhoff et al, Am. J. Physiol. 250, R1021 (1986)
“…With normal EF, the ventricle was in good contractile state with Ees 4.5 mm Hg/ml/m2 and EF 60% or more. We found that their Ea was always set less than Ees and resulted in greater work efficiency and a smaller SW……… In those patients whose ventricles were in a mildly depressed state with Ees 2.5 mmHg/ml/m2 and EF 50%, Ea Ees… their ventricles were performing at almost maximal SW possible at a given preload. In those patients whose ventricles were severely depressed with Ees of 1.5 mm Hg/ml/m2 and EF less than 40%, Ees < Ea…” Asanoi et al, Circ. Res.65, 483 -93 (1989)
The physiological state of the heart and the ESPVR normal physiological state Emax/eam 2 (point d1) SV/(Ved - Vom ) > 0.5 mildly depressed state Emax/eam 1 (point d5) SV/(Ved – Vom ) = 0.5 severly depressed state Emax/eam 1 (d1 above d5) ------------------------------------------- stroke work= Pm ( Ved - Vm) = SW stroke work reserve = SWR = (SW)max - SW Emax = max. ventricular elastance eam = arterial elastance
Data from Asanoi et al, Circ. Res. EF > 60% *; 40% < EF < 59% o; EF < 40% x
Experimental verificationof the previous results for the right ventricle(experiments on dogs). Brimouille, Am. J. Physiol. 284,H1625, 2003 Critical review of the determination of Ees(or Emax) from a single beat measurement: Kjorstad, Korvald, Myrmel, Am. J. Physiol. 282,H1739, 2002
The ejection fraction, EF = SV/Ved Patients with symptoms of heart failure & preserved ejection fraction (HFpEF), defined as EF > 50%. “This symdrome predominantly afflicts older hypertensive individuals…. Recent studies have shown that the mortality rate, the hospital readmission rate, and the economic cost of HFpEF rival those of HFrEF.” (Najjar, JACC, 54(5), 419 (2009)) “More than ¾ of patients with heart failure (HF) have antecedent hypertension. Hypertension appears to play an especially important role in HFpEF.” (Little, Circulation, 118, 2223 (2008))
Optimal value of EF ≈ 0.67 ≈ 2/3 around normalgroup (*) that appears at the bottom of the curve. Dumesnil, Shoucri, Laurenceau, Turcot Circulation 59, 1024 (1979) normal case *, aortic stenosis o, valvular regurgitation +, mitral valvular regurgitation ^, miscellaneous cardiomyopathies x
Optimal value of EF ≈ 0.67 for all curves. Each group ofordinate values is divided byits respectivestandard variation. Dumesnil, Shoucri, Laurenceau, Turcot Circulation 59, 1024 (1979) normal case *, aortic stenosis o, valvular regurgitation +, mitral valvular regurgitation ^, miscellaneous cardiomyopathies x
Pisom – Pm =gradient of pressureacross theendocardium. Pm = left ventricularpressure. Dumesnil, Shoucri, Laurenceau, Turcot Circulation 59, 1024 (1979) normal case *, aortic stenosis o, valvular regurgitation +, mitral valvular regurgitation ^, miscellaneous cardiomyopathies x
Optimal value of (Pisom – Pm)/Pm ≈ 1.3 around normal group (*); similarly on the right hand side. Dumesnil, Shoucri, Laurenceau, Turcot Circulation 59, 1024 (1979) normal case *, aortic stenosis o, valvular regurgitation +, mitral valvular regurgitation ^, miscellaneous cardiomyopathies x
Optimal value of EF ≈ 0.67 ≈ 2/3 around normalgroup (*) Optimal value of SW/TW ≈ 0.5 around normalgroup (*) SW = stroke workTW = total area under ESPVR Dumesnil, Shoucri, Laurenceau, Turcot Circulation 59, 1024 (1979) normal case *, aortic stenosis o
Optimal value of EF ≈ 0.67 ≈ 2/3 around normalgroup (*) Optimal value of SWR/SW ≈ 0.26 around normalgroup (*) . SWR = SWx – SW = stroke work reserve SW = stroke work Dumesnil, Shoucri, Laurenceau, Turcot Circulation 59, 1024 (1979) normal case *, aortic stenosis o
Optimal value of EF ≈ 0.67 ≈ 2/3 around normalgroup (*) . Optimal value of SV/(Ved– Vo2) ≈0.57 around normalgroup (*) SV = Ved – Vm = stroke volume Dumesnil, Shoucri, Laurenceau, Turcot Circulation 59, 1024 (1979) normal case *, aortic stenosis o,
Optimal value of EF ≈ 0.67 ≈ 2/3 around normalgroup (*) . Optimal value of SV/(Ved– Vot) ≈ 0.8 around normalgroup (*) SV = Ved – Vm = stroke volume Dumesnil, Shoucri, Laurenceau, Turcot Circulation 59, 1024 (1979) normal case *, aortic stenosis o
Optimal value of EF ≈ 0.67 ≈ 2/3 around normalgroup (*) , with SV/(Vm – Vot) ≈ 4 SW/SWx ≈ 0.8 For the critical value EF ≈ 0.33≈ 1/3, we have SV/(Vm– Vot) ≈ 1SW/SWx = 1 SWx = maximum stroke work reserve SW = stroke work SV = stroke work = Ved - Vm normal case *, hypertrophy x, dilated MC +, volume overload o, Data from Azancot et al, J. Physiol. (Paris), 77, p. 695, (1981)
Optimal value of (Pisom– Pm)/Pm≈1.33 around normalgroup (*) , with SWR/SW ≈ 0.26 SW/SWx ≈ 0.8 For the critical value (Pisom– Pm)/Pm≈ 0.63 we have SWR/SW ≈ 0SW/SWx = 1 SWR = SWx – SW = stroke work reserve SW = stroke work normal case *, hypertrophy x, dilated MC +, volume overload o, Data from Azancot et al, J. Physiol. (Paris), 77, p. 695, (1981)
Optimal value of SWR/SW ≈ 0.26for all curves.Each group ofordinate values is divided byits respectivestandard variation SWR = SWx – SW = stroke work reserve SW = stroke work Dumesnil, Shoucri, Laurenceau, Turcot Circulation 59, 1024 (1979) normal case *, aortic stenosis o, valvular regurgitation +, mitral valvular regurgitation ^, miscellaneous cardiomyopathies x
Two-dimensionaldisplay of data givesbetter segregation between clinicalgroups. Dumesnil, Shoucri, Laurenceau, Turcot Circulation 59, 1024 (1979) : normal case *, aortic stenosis o, valvular regurgitation +, mitral valvular regurgitation ^, miscellaneous cardiomyopathies x
Two-dimensionaldisplay of data givesbetter segregation between clinicalgroups. Dumesnil, Shoucri, Laurenceau, Turcot Circulation 59, 1024 (1979) normal case *, aortic stenosis o, valvular regurgitation +, mitral valvular regurgitation ^, miscellaneous cardiomyopathies x
Two-dimensionaldisplay of data givesbetter segregation between clinicalgroups. Bivariate analysisof data is superiorto univariateanalysis of data Dumesnil, Shoucri, Laurenceau, Turcot Circulation 59, 1024 (1979) Grp1: normal case *, aortic stenosis o,
normal case *, hypertrophy x, dilated MC +, volume overload o, Data from Azancot et al, J. Physiol. (Paris), 77, p. 695, (1981)
Conclusion • The ESPVR corresponds to the max. state of activation of the myocardium during contraction. • The Ejection Fraction EF is just one index, many other indexes can be derived from the ESPVR. • No one index gives a perfect segregation between all different clinical groups. Some indexes are better than others depending on the clinical groups. • Bivariate (or multivariate) analysis of data is a better approach for diagnostic purposes in future studies of HFpEF.