Download
1 / 8
80 likes | 81 Views
Learn about the Volunteer-CSI Monitoring Partnership that tracks water quality in Fall and Virgil Creeks. Find out how to estimate phosphorus loads and the importance of reducing phosphorus levels in Cayuga Lake.

E N D
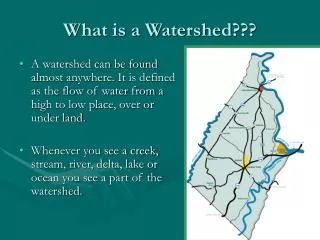
What’s in Your Watershed?Fall and Virgil Creeks Volunteer-CSI Monitoring Partnership Tracks Water Quality Wednesday, January 15, 2014, 6:30 PM Tompkins County Public Library Steve Penningroth, Community Science Institute
Interactive Water Quality Database • CSI has partnered with volunteer groups to track water quality since 2002 • Results are organized in CSI’s open online database by “monitoring set” (*) • Database can be searched and search results downloaded free of charge (*) • Data can be combined with USGS flow data to estimate phosphorus loads
Phosphorus and Sediment Loading to the South End of Cayuga Lake
Why are Phosphorus Loads Important? • South end of Cayuga Lake is on DEC’s and EPA’s 303(d) list of impaired water bodies • Under federal Clean Water Act, remediation requires reduction of phosphorus loads • Load reduction is based on limits called Total Maximum Daily Loads, or TMDLs • Cornell University’s Cayuga Lake Modeling Project from 2013 to 2017 is designed to provide DEC and EPA withphosphorus data to develop TMDLs
How To Estimate Phosphorus Loads? Monitoring vs. Modeling Phosphorus loads based on monitoring • CSI-volunteer monitoring partnerships collect water samples and produce “on the ground” phosphorus data year in and year out • Phosphorus data are combined with flow data from USGS gauging stations to calculate loads using USGS software called LOADEST Phosphorus loads based on modeling • The Cayuga Lake Modeling Project will use a mathematical model to simulate loading based on a number of inputs, for example, land use, soil type, and precipitation • Cornell’s loading model will be calibrated using “on the ground” data collected in 2013 by their contractor, Upstate Freshwater Institute • Model will be validated against “on the ground” data collected before and after 2013, such as CSI-volunteer monitoring data • Finished model will be used by DEC to guide development of TMDL
Issues Around a Phosphorus TMDL • TMDLs are designed for point sources, but CSI’s data indicate ~90% of phosphorus that is loaded to the south end of Cayuga Lake comes from non-point sources in watersheds of tributary streams • Nature and degree of impairment are debatable: - Swimming has not been permitted at Stewart Park since the 1960s due to turbidity (muck), and it is questionable whether a phosphorus TMDL could address this problem - Total phosphorus on southern shelf averages around the 20 ppb threshold of eutrophication
TMDL Issues (cont’d) • Studies suggest that a significant part of the turbidity at the south end of Cayuga Lake is caused by suspended mineral particles such as clay and calcium carbonate • Studies show there is little, if any, correlation between algae growth (chlorophyll a) and phosphorus levels at the south end of Cayuga Lake