Download
1 / 15
150 likes | 194 Views
Learn about effective pruning methods like Reduced-Error Pruning in decision trees to prevent overfitting by removing noisy data. Understand how to evaluate models using Confusion Metrics and lift to improve classification performance.

E N D
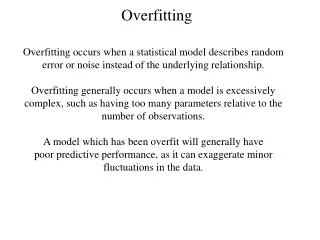
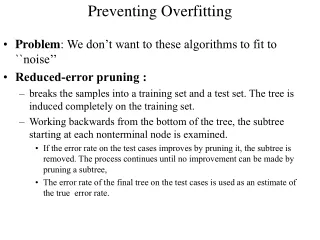
Problem: We don’t want to these algorithms to fit to ``noise’’ Reduced-error pruning : breaks the samples into a training set and a test set. The tree is induced completely on the training set. Working backwards from the bottom of the tree, the subtree starting at each nonterminal node is examined. If the error rate on the test cases improves by pruning it, the subtree is removed. The process continues until no improvement can be made by pruning a subtree, The error rate of the final tree on the test cases is used as an estimate of the true error rate. Preventing Overfitting
Decision Tree Pruning: physician fee freeze = n: | adoption of the budget resolution = y: democrat (151.0) | adoption of the budget resolution = u: democrat (1.0) | adoption of the budget resolution = n: | | education spending = n: democrat (6.0) | | education spending = y: democrat (9.0) | | education spending = u: republican (1.0) physician fee freeze = y: | synfuels corporation cutback = n: republican (97.0/3.0) | synfuels corporation cutback = u: republican (4.0) | synfuels corporation cutback = y: | | duty free exports = y: democrat (2.0) | | duty free exports = u: republican (1.0) | | duty free exports = n: | | | education spending = n: democrat (5.0/2.0) | | | education spending = y: republican (13.0/2.0) | | | education spending = u: democrat (1.0) physician fee freeze = u: | water project cost sharing = n: democrat (0.0) | water project cost sharing = y: democrat (4.0) | water project cost sharing = u: | | mx missile = n: republican (0.0) | | mx missile = y: democrat (3.0/1.0) | | mx missile = u: republican (2.0) Simplified Decision Tree: physician fee freeze = n: democrat (168.0/2.6) physician fee freeze = y: republican (123.0/13.9) physician fee freeze = u: | mx missile = n: democrat (3.0/1.1) | mx missile = y: democrat (4.0/2.2) | mx missile = u: republican (2.0/1.0) Evaluation on training data (300 items): Before Pruning After Pruning ---------------- --------------------------- Size Errors Size Errors Estimate 25 8( 2.7%) 7 13( 4.3%) ( 6.9%) <
False Positives Predicted True Positives False Negatives Actual Evaluation of Classification Systems Training Set: examples with class values for learning. Test Set: examples with class values for evaluating. Evaluation: Hypotheses are used to infer classification of examples in the test set; inferred classification is compared to known classification. Accuracy: percentage of examples in the test set that are classified correctly.
Analytic goal: achieve understanding Exploratory evaluation : understand a novel area of study Experimental evaluation : support or refute some models Engineering goal : solve a practical problem Estimator of classifiers : accuracy Accuracy : how well does a model classify Higher accuracy does not necessarily imply better performance on target task Model Evaluation
Confusion Metrics - + Actual Class Entries are counts of correct classifications and counts of errors Y A: True + B : False + Predicted class N C : False - D : True - • Other evaluation metrics • True positive rate (TP) = A/(A+C)= 1- false negative rate • False positive rate (FP)= B/(B+D) = 1- true negative rate • Sensitivity = true positive rate • Specificity = true negative rate • Positive predictive value = A/(A+B) • Recall = A/(A+C) = true positive rate = sensitivity • Precision = A/(A+B) = PPV
Probabilistic Interpretation of CM Posterior probabilities likelihoods approximated using error frequencies prior probabilities approximated by class frequencies P (+) : P (-) P(+ | Y) P(- | N) P(Y |+) P(Y |- ) Class Distribution Defined for a particular training set Confusion matrix Defined for a particular classifier
Cost and Benefits Medical diagnosis : cost of falsely indicating “cancer” is different from cost of missing a true cancer case Fraud detection : cost of falsely challenging customer is different from cost of leaving fraud undetected Customer segmentation : Benefit of not contacting a non-buyer is different from benefit of contacting a buyer More Than Accuracy
Must take costs and distributions into account Calculate expected profit: profit = P(+)*(TP*B(Y, +) + (1-TP)*C(N, +)) + P(-)*((1-FP)*B(N, -) + FP*C(Y, -)) Choose the classifier that maximises profit Model Evaluation within Context Benefits of correct classification costs of incorrect classification
Lift = P(+ | Y)/P(+) : How much better with model than without Lift & Cumulative Response Curves
ROC Curves ROC (Receiver Operating Characteristic) Space : Each classifier is represented by plotting its (FP, TP) pair Good measure of overall model performance and target conditions are completely unknown Good model : maximising AUC (Area under Curve) Better estimation : a good model extends the ROC Convex Hull
Contributory Models : retain training data points; each potentially affects the estimation at new point