Download
1 / 30
300 likes | 405 Views
The Characteristics of Employed Female Caregivers and their Work Experience History. Sheri Sharareh Craig Alfred O. Gottschalck U.S. Census Bureau Housing and Household Economic Statistics Division Labor Force Statistics Branch. Introduction. Background.

E N D
The Characteristics of Employed Female Caregivers and their Work Experience History Sheri Sharareh Craig Alfred O. Gottschalck U.S. Census Bureau Housing and Household Economic Statistics Division Labor Force Statistics Branch
Background • According to projections from the Bureau of Labor Statistics, females will make up nearly half of the work force (47 percent), and 51 percent of the new additions to the labor force, between 2004 and 2014. • As female workforce participation increases, caregiving could pose even greater financial challenges for many female workers given that females compose the majority of caregivers. • Data from the 2004 Survey of Income and Program Participation (SIPP) show that individuals who interrupt their work careers to provide care (i.e., caregivers) have lower mean earnings compared to those who do not have such work career interruptions (i.e., non-caregivers).
Employed caregivers were more likely to be women. Percent Distribution of Caregiver Status by Sex (N=61.2 million) (N=53.6 million) (N=14.6 million) (N=100.4 million)
Objective • The purpose of this research is to investigate the type of work interruptions experienced by currently employed women by comparing the demographic and socioeconomic characteristics, such as sex, age, race, educational attainment, occupation, and earnings, of women with past caregiving and non-caregiving work histories.
Percent Distribution of Employed Women by Work Interruption Status
Focus of Analysis • What are the characteristics of employed women who have interrupted their work life at any time, for 6 months or longer, to provide care for a minor child, an elderly family member, or a disabled but non-elderly family member compared to women who have not had such interruptions?
Universe Employed women 25-62 years old, who have ever worked six straight months or longer. N= 53.6 million
Definitions • Caregivers: Those who had a work interruption for 6 months or longer from a paid job or business because they were taking care of a child, an elderly family member, or a disabled but non-elderly family member. N = 13.6 million • Non-caregivers: Those whohad a work interruption for 6 months or longer at a paid job or business for reasons other than caregiving or did not have any work interruptions over their work life. N = 40.1 million
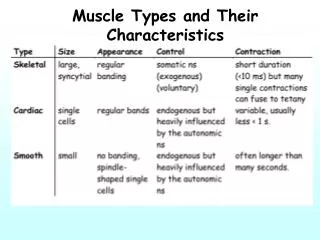
Definitions - continued • Work Interruption: An interruption of work lasting 6 straight months or longer. • Employed Workers: Persons with a job or business during the reference period. • Main Caregiving Responsibility: The main caregiving responsibility during the caregiving episode; that is, for a minor child, an elderly family member, or a disabled but non-elderly family member.
Data Source • Survey of Income and Program Participation (SIPP) • Multistage-stratified sample of the U.S. civilian noninstitutionalized population • Approximately 38,000 longitudinally interviewed households • Typically each panel is 2 ½ to 4 years in length • Collects demographic, labor force, income, and program participation data • SIPP wave one, 2004 panel collected from February–May 2004
Data Source - continued • The Employment History Topical Module Collects data on: • Patterns of employment • Number of times away from work (i.e., interruptions of 6 months or longer) • Reasons for work interruption (e.g., for caregiving) • Length of interruption
Female caregivers and Female non-caregivers were equally likely to be currently employed. Employment Status of Women 25-62 Years by Caregiving Status
Caregivers only
Employed women who had interruptions in their work life for caregiving were more likely to be White non-Hispanic and less likely to be Black. Percent Distribution of Race by Caregiving * American Indian or Alaska Native and Native Hawaiian or other Pacific Islander
Employed female caregivers were more likely to be married than non-caregivers. Percent Distribution of Marital Status by Caregiver Status
Employed female caregivers were more likely to have cared for a child during their caregiving interruption. Percent Distribution of Main Caregiving Responsibility Among Employed Women Caregivers (n=13.6 million) (n=12.8 million) (n=0.5 million) (n=2.1 million)
Forty-three percent of female caregivers had two or more work interruptions in their lifetime for caregiving. Percent Distribution of Employed Female Caregivers by Number of Interruptions (n=13.6 million)
Caregiving women with two or more interruptions currently earned less per month than caregiving women with only one interruption for caregiving. Mean Monthly Earnings for Employed Women Caregivers by Number of Interruptions for Caregiving The difference between mean earnings is statistically significant at the 10% level. 2004 dollars
Caregiver vs. Non-caregiver Comparisons
Caregivers were more likely to be between 45 and 62 years old. Percent Distribution of Age by Caregiver Status
Employed female caregivers were less likely to have a bachelor’s degree or higher levels of educational attainment than non-caregivers. Percent Distribution of Educational Attainment by Caregiver Status Non-caregiver
There were small differences between employed female caregivers and non-caregivers in terms of work experience. This may be due to caregivers being older on average and/or working longer to catch up as a result of lost time in the workforce.Percent Distributions of Employed Female Caregivers and Non-caregivers by Work Experience Caregiver Non-caregiver
Employed female non-caregivers were more likely to be in management, professional and related occupations, and employed female caregivers were more likely to be in sales and office occupations. Percent Distribution of Occupation by Caregiver Status
Although the majority of the employed female caregivers worked full time over their work careers, those who had interruptions to take care of someone were more likely to currently work part time compared to those who never had such interruptions. Percent Distribution of Caregivers and Non-caregivers by Work Status
Caregiving women had lower mean monthly earnings than non-caregiving women. Mean Monthly Earnings for Caregiver and Non-caregiver Women The difference between mean earnings is statistically significant at the 10% level. 2004 dollars
Compared with non-caregivers, caregivers were more likely to: • Be older • Be less educated • Possess similar work experience levels • Work in a sales or office type occupation • Be part-time employees • Earn less money
Caregivers were more likely to: • Be White non-Hispanic • Be married • Have taken care of a child rather than an elderly or disabled family member • Have interrupted their work careers two or more times • Earn more if they only have one work interruption compared to those caregivers with multiple work interruptions
Contact Information Sheri Sharareh Craig sheri.s.sharareh.craig@census.gov Phone: (301) 763-5793 U.S. Census Bureau