Download
1 / 41
490 likes | 841 Views
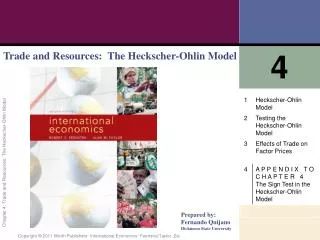
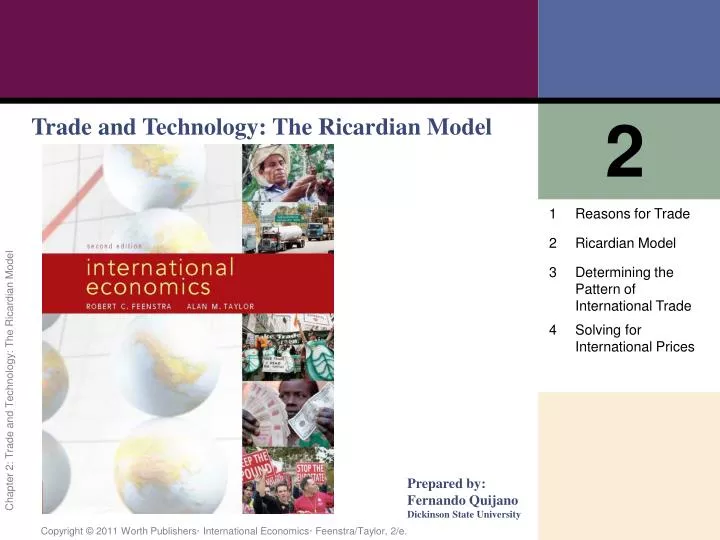
2. Trade and Technology: The Ricardian Model. Prepared by: Fernando Quijano Dickinson State University. Introduction. In this chapter we will: Learn the reasons why countries trade Distinguish between absolute and comparative advantage Understand the Ricardian model

E N D
2 Trade and Technology: The Ricardian Model Prepared by:Fernando QuijanoDickinson State University
Introduction • In this chapter we will: • Learn the reasons why countries trade • Distinguish between absolute and comparative advantage • Understand the Ricardian model • Understand the no-trade equilibrium using each country’s PPF and indifference curve • Solve for wages across countries • Solve for international prices • Derive the home export supply curve and foreign import demand curve and how to arrive at international trade equilibrium • Understand how to determine a country’s terms of trade and how they affect that country
Introduction Reasons countries trade goods with each other include: ■ Differences in the technology used in each country (i.e., differences in each country’s ability to manufacture products) ■ Differences in the total amount of resources (including labor, capital, and land) found in each country ■The proximity of countries to each other (i.e., how close they are to one another)
Introduction In this chapter, we focus on technology differences across countries as an explanation for trade. This explanation is often called the Ricardian model. This model explains how the level of a country’s technology affects wages and, in turn, helps to explain how a country’s technology affects its trade pattern. We also explain the concept of comparative advantage and why it works as an explanation for trade patterns.
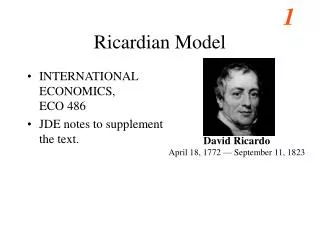
SIDEBAR David Ricardo and Mercantilism • Mercantilists believed that exporting was goodbecause it generated gold and silver for thenational treasury and that importing was bad because it drained gold and silver from the national treasury. • To ensure that a country exported a lot and imported only a little, the mercantilists were in favor of high tariffs. • Ricardo was interested in showing that countries could benefit from international trade without having to use tariffs. • Many of the major international institutions in the world today are founded at least in part on the idea that free trade between countries brings gains for all trading partners.
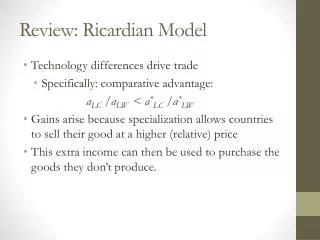
1 Reasons for Trade Absolute Advantage When a country has the best technology for producing a good, it has an absolute advantage in the production of that good. Comparative Advantage Absolute advantage is not a good explanation for trade patterns. Instead, comparative advantage is the primary explanation for trade among countries. A country has comparative advantage in producing those goods that it produces best compared with how well it produces other goods.
Absoluteadvantage International Economics
2 Ricardian Model The Home Country We will assume that labor is the only resource used to produce both goods. The marginal product of labor (MPL) is the extra output obtained by using one more unit of labor. In Home, one worker produces 4 bushels of wheat, so MPLW= 4. Alternatively, one worker can produce 2 yards of cloth, so MPLC= 2.
2 Ricardian Model The Home Country Home Production Possibilities Frontier Using the marginal products for producing wheat and cloth, we can graph Home’s production possibilities frontier (PPF). The slope of the PPF is also the opportunity cost of wheat, the amount of cloth that must be given up to obtain one more unit of wheat. Assume there are 25 workers in Home. If all the workers were employed in wheat, the country could produce 100 bushels. If they were all employed in cloth they could produce 50 yards. The PPF connects these two points.
2 Ricardian Model The Home Country Home Production Possibilities Frontier FIGURE 2-1 The Home PPF is a straight line between 50 yards of cloth and 100 bushels of wheat. The slope of the PPF equals the negative of the opportunity cost of wheat. Equivalently, the magnitude of the slope can be expressed as the ratio of the marginal products of labor for the two goods.
2 Ricardian Model The Home Country • Home Indifference Curve There are several ways to represent demand in the Home economy, but we will start by using indifference curves. • All points on an indifference curve have the same level of utility. • Points on higher indifference curves have higher utility. • Indifference curves are often used to show the preferences of an individual. • Each indifference curve shows the combinations of two goods, such as wheat and cloth, that a person or economy can consume and be equally satisfied.
2 Ricardian Model Home Indifference Curve Home Equilibrium with No Trade FIGURE 2-2 Points A and B lie on the same indifference curve and give the Home consumers the level of utility U1. The highest level of Home utility on the PPF is obtained at point A, which is the no-trade equilibrium. Point D is also on the PPF but would give lower utility. Point C represents a higher utility level but is off of the PPF, so it is not attainable in the absence of international trade.
2 Ricardian Model The Home Country Opportunity Cost and Prices Whereas the slope of the PPF reflects the opportunity cost of producing one more bushel of wheat, under perfect competition the opportunity cost of wheat should also equal the relative price of wheat. Price reflects the opportunity cost of a good.
2 Ricardian Model The Home Country • Wages • In competitive markets firms hire workers up to the point at which the hourly wage equals the value of one more hour of production. • The value of one more hour of labor equals the amount of goods produced in that hour (MPL) times the price of the good. • Labor hired up to the point where wage equals P • MPL for each industry.
2 Ricardian Model The Home Country • Wages • We can use the equality of the wage across industries to obtain the following equation: • PW • MPLW = PC • MPLC • By rearranging terms, we see that • PW/PC = MPLC/MPLW • The right-hand side of this equation is the slope of the production possibilities frontier (the opportunity cost of obtaining one more bushel of wheat). • The left-hand side of the equation is the relative price of wheat.
2 Ricardian Model The Foreign Country • Assume a Foreign worker can produce one bushel of wheat or one yard of cloth. • MPL*W = 1, MPL*C = 1 • Assume there are 100 workers available in Foreign. • If all workers were employed in wheat they could produce 100 bushels. • If all workers were employed in cloth they could produce 100 yards.
2 Ricardian Model The Foreign Country Foreign Production Possibilities Frontier FIGURE 2-3 The Foreign PPF is a straight line between 100 yards of cloth and 100 bushels of wheat. The slope of the PPF equals the negative of the opportunity cost of wheat, that is, the amount of cloth that must be given up (1 yard) to obtain 1 more bushel of wheat.
2 Ricardian Model Comparative Advantage • A country has a comparative advantage in a good when it has a lower opportunity cost of producing than another country. • By looking at the chart we can see that Foreign has a comparative advantage in producing cloth. Home has a comparative advantage in producing wheat.
2 Ricardian Model The Foreign Country Comparative Advantage FIGURE 2-4 Foreign Equilibrium with No Trade The highest level of Foreign utility on the PPF is obtained at point A*, which is the no-trade equilibrium.
3 Determining the Pattern of International Trade International Trade Equilibrium What happens when goods are traded between Home and Foreign? We will see the country’s no-trade relative price determines which product it will export and which it will import. The no-trade relative price equals its opportunity cost of production. The pattern of exports and imports will be determined by the opportunity costs of production in each country—their comparative advantage.
3 Determining the Pattern of International Trade International Trade Equilibrium The relative price of cloth in Foreign is PC/PW = 1. The relative price of cloth in Home is PC/PW = 2. Therefore Foreign would want to export their cloth to Home—they can make it for $1 and export it for more than $1. The opposite is true for wheat. Home will export wheat and Foreign will export cloth. Both countries export the good for which they have the comparative advantage.
3 Determining the Pattern of International Trade International Trade Equilibrium • How Trade Occurs • As Home exports wheat, quantity of wheat sold at Home falls. • The price of wheat at Home is bid up. • More wheat goes into Foreign’s market. • The price of wheat in Foreign falls. • As Foreign exports cloth, the quantity sold in Foreign falls, and the price in Foreign for cloth rises. • The price of cloth at Home falls.
3 Determining the Pattern of International Trade International Trade Equilibrium • The two countries are in an international trade equilibrium when the relative price of wheat is the same in the two countries. • This means that the relative price of cloth is also the same in both countries. • To fully understand the international trade equilibrium, we are interested in two issues: • Determining the relative price of wheat (or cloth) in the trade equilibrium • Seeing how the shift from the no-trade equilibrium to the trade equilibrium affects production and consumption in both Home and Foreign.
3 Determining the Pattern of International Trade International Trade Equilibrium The relative price of wheat in the trade equilibrium will be between the no-trade price in the two countries. For now we will assume the free-trade price of Pw/Pcis 2/3. This is between the price of ½ in Home and 1 in Foreign. We can now take this price and see how trade changes production and consumption in each country. The world price line shows the range of consumption possibilities that a country can achieve by specializing in one good and engaging in international trade.
3 Determining the Pattern of International Trade International Trade Equilibrium Change in Production and Consumption Home Equilibrium with Trade FIGURE 2-5 (1 of 3) With a world relative price of wheat of 2/3, Home production will occur at point B. Through international trade, Home is able to export each bushel of wheat it produces in exchange for 2/3 yard of cloth.
3 Determining the Pattern of International Trade International Trade Equilibrium Change in Production and Consumption Home Equilibrium with Trade (continued) FIGURE 2-5 (2 of 3) As wheat is exported, Home moves up the world price line BC. Home consumption occurs at point C, at the tangent intersection with indifference curve U2, since this is the highest possible utility curve on the world price line.
3 Determining the Pattern of International Trade International Trade Equilibrium Change in Production and Consumption FIGURE 2-5 (3 of 3) Home Equilibrium with Trade (continued) Given these levels of production and consumption, we can see that total exports are 60 bushels of wheat in exchange for imports of 40 yards of cloth and also that Home consumes 10 fewer bushels of wheat and 15 more yards of cloth relative to its pre-trade levels.
3 Determining the Pattern of International Trade International Trade Equilibrium International Trade Home obtains a higher utility with international trade than in the absence of international trade (U2 is higher than U1); the finding that Home’s utility increases with trade is our first demonstration of the gains from trade, by which we mean the ability of a country to obtain higher utility for its citizens under free trade than with no trade. FIGURE 2-5 (revisited)
3 Determining the Pattern of International Trade International Trade Equilibrium Pattern of Trade and Gains from Trade FIGURE 2-6 (1 of 2) Foreign Equilibrium with Trade With a world relative price of wheat of 2/3, Foreign production will occur at point B*. Through international trade, Foreign is able to export 2/3 yard of cloth in exchange for 1 bushel of wheat, moving down the world price line.
3 Determining the Pattern of International Trade International Trade Equilibrium Pattern of Trade and Gains from Trade FIGURE 2-6 (2 of 2) Foreign Equilibrium with Trade (continued) Foreign consumption occurs at point C*, and total exports are 40 yards of cloth in exchange for imports of 60 bushels of wheat. Relative to its pre-trade wheat and cloth consumption (point A*), Foreign consumes 10 more bushels of wheat and 10 more yards of cloth.
3 Determining the Pattern of International Trade Pattern of Trade and Gains from Trade • Each country is exporting the good for which it has the comparative advantage. • This confirms that the pattern of trade is determined by comparative advantage. • This is the first lesson of the Ricardian model. • There are gains from trade for both countries. • This is the second lesson of the Ricardian model.
3 Determining the Pattern of International Trade Solving for Wages across Countries Absolute Advantage As our example shows, wages are determined by absolute advantage. In contrast, the pattern of trade is determined by comparative advantage.
3 Determining the Pattern of International Trade Solving for Wages across Countries • As stated before, in competitive labor markets, firms will pay workers the value of their marginal product. • Since Home produces and exports wheat, they will be paid in terms of that good—the real wage is MPLW = 4 bushels of wheat. • The workers sell the wheat on the world market at a relative price of PW/PC = 2/3. • We can use this to calculate the real wage in terms of cloth: (PW/PC)MPLW = (2/3)4 = 8/3 yards.
3 Determining the Pattern of International Trade Solving for Wages across Countries • We can do this for Foreign as well and summarize: • Home real wage is: • 4 bushels of wheat • 8/3 yards of cloth. • Foreign real wage is: • 3/2 bushels of wheat • 1 yard of cloth. • Foreign workers earn less than Home workers as measured by their ability to purchase either good. • This fact reflects Home’s absolute advantage in the production of both goods.
4 Solving for International Prices Home exports wheat, so we will derive a Home export supply curve, which shows the amount it wants to export at various relative prices. Foreign imports wheat, so we will derive a Foreign import demand curve, which shows the amount of wheat that it will import at various relative prices.
4 Solving for International Prices Home Export Supply Curve FIGURE 2-9 (1 of 2) Home Export Supply Panel (a) repeats Figure 2-5 showing the trade equilibrium for Home with production at point B and consumption at point C. Panel (b) shows the Home export supply of wheat.
4 Solving for International Prices Home Export Supply Curve FIGURE 2-9 (2 of 2) Home Export Supply (continued)For relative prices above 1/2, Home exports more than 50 bushels, along the segment B C. For example, at the relative price of 2/3, Home exports 60 bushels of wheat.
4 Solving for International Prices Foreign Import Demand Curve FIGURE 2-10 (1 of 2) Foreign Import Demand Panel (a) repeats Figure 2-6. Panel (b) shows Foreign import demand for wheat. When the relative price of wheat is 1, Foreign will import any amount of wheat between 0 and 50 bushels, along the segment A*B* of the Foreign import demand curve.
4 Solving for International Prices Foreign Import Demand Curve FIGURE 2-10 (2 of 2) Foreign Import Demand (continued) For relative prices below 1, Foreign imports more than 50 bushels, along the segment B*C*. For example, at the relative price of 2/3, Foreign imports 60 bushels of wheat.
4 Solving for International Prices International Trade Equilibrium FIGURE 2-11 World Market for Wheat Putting together the Home export supply curve and the Foreign import demand curve for wheat, the world equilibrium is established at point C, where the relative price of wheat is 2/3.
4 Solving for International Prices International Trade Equilibrium • The Terms of Trade The price of a country’s exports divided by the price of its imports is called the terms of trade. • Because Home exports wheat, (PW/PC) is its terms of trade. • Foreign exports cloth, so (PW/PC) is its terms of trade. • In this case, having a higher price for cloth (Foreign’s export) or a lower price for wheat (Foreign’s import) would make the Foreign country better off.