Download
1 / 34
340 likes | 527 Views
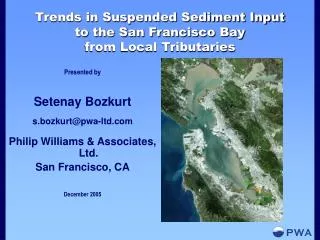
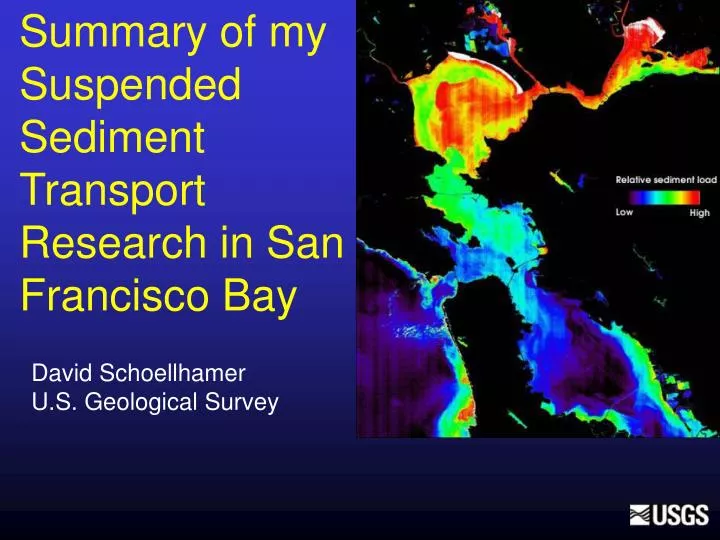
Summary of my Suspended Sediment Transport Research in San Francisco Bay. David Schoellhamer U.S. Geological Survey. Acknowledgements.

E N D
Summary of my Suspended Sediment Transport Research in San Francisco Bay David Schoellhamer U.S. Geological Survey
Acknowledgements Greg Brewster, Paul Buchanan, Jay Davis, Judy Drexler, Amber Forest, Neil Ganju, Bruce Jaffe, Megan Lionberger, Michael MacWilliams, Andy Manning, Lester McKee, Tara Morgan, Cathy Ruhl, Rob Sheipline, Greg Shellenbarger, Brad Sullivan, Kathleen Swanson, John Takekawa, John Warner, Scott Wright, and more Funding: U.S. Army Corps of Engineers, SF Regional Water Quality Control Board, Interagency Ecological Program, California Coastal Conservancy, US Fish and Wildlife Service, USGS programs, and more
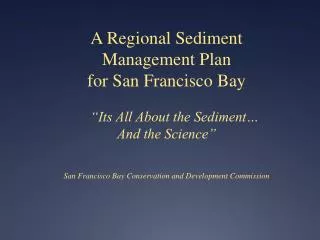
“Regional sediment management recognizes sediment as a resource.” • Erosion and deposition processes: is sediment suspended? • Fluxes: How much is sediment is moving? • Sources and sinks: Where is it coming from and going to? • Surplus and deficits: Is there too much or too little? • Information gaps: What are the greatest uncertainties?
Erosion and deposition processes Point San Pablo, mid-depth Processes
Erosion and deposition processes Point San Pablo, mid-depth Semidiurnal tides Spring/neap cycle Lunar month Solstice/equinox Processes
Erosion and deposition processes Point San Pablo, mid-depth Flood Processes
Erosion and deposition processes Point San Pablo, mid-depth Wind wave resuspension Processes
Delta Outflow and SSC Processes
Connectivity of Central Bay to Delta Bay Bridge Processes Thank you CASCaDE colleagues
Connectivity of Central Bay to Delta Bay Bridge Processes Thank you CASCaDE colleagues
Estuarine Turbidity Maxima • Naturally occurring maxima of suspended-sediment concentration • Generally caused by convergent sediment transport or trapping • Vary with spring/neap cycle and seasonally Processes
Floc settling velocities • Freshwater sediment is flocculated Andy Manning Processes
Floc settling velocities • Freshwater sediment is flocculated • No concentration effect observed Processes
Floc settling velocities • Freshwater sediment is flocculated • No concentration effect observed • Larger flocs settled at slack tide, sand in flocs Slack tide Processes
Floc settling velocities • Freshwater sediment is flocculated • No concentration effect observed • Larger flocs settled at slack tide, sand in flocs • Settling velocity correlates with 66 minute lagged tidal velocity (courtesy Michael MacWilliams) Processes
“Regional sediment management recognizes sediment as a resource.” • Erosion and deposition processes: is sediment suspended? • Fluxes: How much is sediment is moving? • Sources and sinks: Where is it coming from and going to? • Surplus and deficits: Is there too much or too little? • Information gaps: What are the greatest uncertainties?
Aquadopp ADCP DTS-12 Turbidity Probe with wiper Flux
Dumbarton Cumulative Sediment Flux • Negative is flood tide direction (into far south SFB) • Uncertainty analysis not completed, previously ±30-40% Flux
South Bay source and restoration sink • Suspended-sediment flux into far SFB • Tributary input: 20,000 m3/yr • Past Dumbarton: 617,000 m3/yr • Approximate time to fill subsided volume (32 Mm3) • Tributaries input: 1,600 yrs • Past Dumbarton: 50 yrs Sources/sinks
Suspended Sediment Flux Measurements Flux, Sources/sinks
Sacramento River annual sediment yield >99% probability (p<0.01) of decreasing trends, both discharge bins Sources/sinks
Tidal creeks are a sediment sink Corte Madera Creek gages Relief map of the Corte Madera Creek watershed by Dewey Livingston Friends of Corte Madera Creek Watershed Sources/sinks
Normal 1995-2002 annual budget Pacific Ocean is a large poorly quantified sediment sink Sources/sinks
“Regional sediment management recognizes sediment as a resource.” • Erosion and deposition processes: is sediment suspended? • Fluxes: How much is sediment is moving? • Sources and sinks: Where is it coming from and going to? • Surplus and deficits: Is there too much or too little? • Information gaps: What are the greatest uncertainties?
WY1999: 36% step decrease in Bay SSC Point San Pablo, mid-depth, USGS Surplus/deficit
Transport regulation Surplus/deficit
Supply regulation Surplus/deficit
Organic matter Pore space Wetland sustainability and sea level rise Surface cohort Organic input Initial pore space Mineral input Buried cohort Processes: Decomposition Compaction Root growth Inorganic material Revising Callaway model Surplus/deficit
0.06 m SLR, CASCaDE Mudflat and marsh sustainability • Where deposition does not keep up with sea level rise • Mudflats lost, wave energy on shoreline increases, shoreline erodes Surplus/deficit
“Regional sediment management recognizes sediment as a resource.” • Erosion and deposition processes: is sediment suspended? • Fluxes: How much is sediment is moving? • Sources and sinks: Where is it coming from and going to? • Surplus and deficits: Is there too much or too little? • Information gaps: What are the greatest uncertainties?
Information gaps • For a numerical model of San Francisco Bay sediment: • Delta supply: direct measurement, future trend • Local watershed supply considering tidal reaches • Ocean exchange: Golden Gate flux • Bottom sediment and variability • Quantify erosion and settling • Bed sediment dynamics • Calibration/validation: flux more robust than concentration • Vegetation: tidal marsh accretion, shoreline erosion • Watersheds model, including Central Valley • Describe connectivity of watersheds, estuary, and ocean • Linkage to ecology and contaminants