Download
1 / 29
290 likes | 429 Views
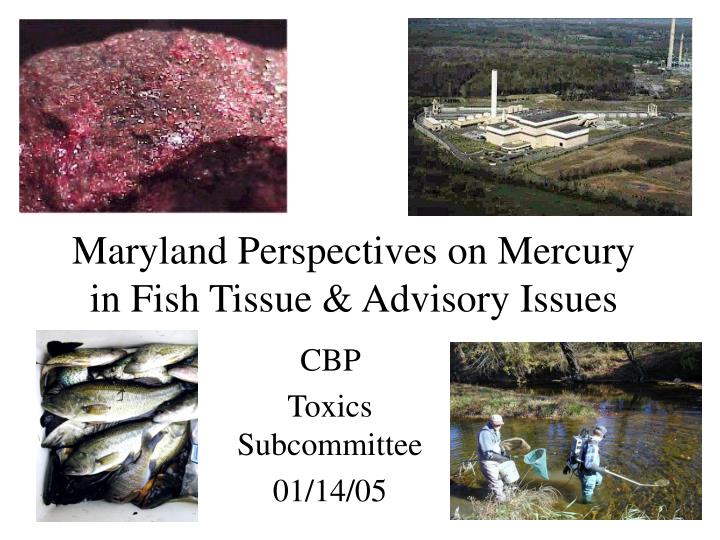
Maryland Perspectives on Mercury in Fish Tissue & Advisory Issues. CBP Toxics Subcommittee 01/14/05. Outline. Sampling Stations Overview of Tissue Concentrations Overview of Risk Assessment/Advisory Discussion. FRESHWATER. Piney Run Reservoir. Spring Gap. Lake Lariat.

E N D
Maryland Perspectives on Mercury in Fish Tissue & Advisory Issues CBP Toxics Subcommittee 01/14/05
Outline • Sampling Stations • Overview of Tissue Concentrations • Overview of Risk Assessment/Advisory • Discussion
Piney Run Reservoir Spring Gap Lake Lariat
Total Mercury in Largemouth Bass and Bluegill • Trophic Level 4 (Large and Smallmouth Bass) • Found in freshwater impoundments, larger freshwater stream segments, and tidal fresh portions of Bay tributaries • Samples consist of individual and composite samples that are legal size
EPA Fish Tissu e Criterion = 300 ppb MDE Hg Advisory Screening Level = 32 ppb
Black Bass (Freshwater): Summary • Summary Statistics • Total # of analytical samples 255 • DNR = 255 • MDE = 0 • Overall Average = 305 ± 255 ppb • Average Statewide Advisory Lakes = 242± 151 ppb • Average High Mercury Lakes = 688± 391 ppb • MDE Data Only (2002, 2003) = 106 ± 82 ppb • Concentration Range • Statewide Advisory Lakes (31-656 ppb) • High Mercury Lakes (174-2076 ppb) • Advisory Levels • Total # samples > FDA Action Level = 3 • SA Total # samples > EPA Tissue Criterion = 45/255 (17.6%) • HM Total # samples > EPA Tissue Criterion = 27/30 (90%)
Freshwater Species Management Implications based on Mercury • Statewide Consumption Advisory was necessary • Tier 1 Statewide • General Population = 4 meals per month • Women of Child-bearing age = 4 meals per month • Children 0-6 = 2 Meals per month • Tier 2 =High Mercury Lakes • General Population = 1 meal per month • Women of Child-bearing age = 1meal per month • Children 0-6 = No consumption • TMDLs have been developed for 9 impoundments • Models available during development indicated > 90 reduction from air sources • TMDLs may be refined as more data and better models become available – EPA requirement for review every 5 years
White Perch • Trophic Level 3 gamefish • Semi-anadromous – tributary fidelity – representative of local conditions (PCBs – King et.al. 2004) • Samples consist of composites of fish of harvestable size (BPJ – since no legal slot limit exists)
White Perch Sample Locations Chesapeake Bay Tributaries Bay Tributaries Sampled Sassafrass R. Chester R. Choptank R. Nanticoke R. Pocomoke R. Patapsco R. Severn R. Rhode/West R.
White Perch Summary • Summary Statistics • Total # of analytical samples 19 composites (94 fish) • Average = 30 ± 20 ppb • Concentration Range • Overall (5 ppb [Elk R.] – 84 ppb [Patapsco R.]) • Advisory Levels • 7/19 Composites exceeded minimal screening threshold (32 ppb – lower threshold for children 0-6 @ 8 meals per month), BUT • No advisories exist for white perch due to mercury since all tributaries are impacted by PCBs (risk driver)
Striped Bass (Rockfish) • Trophic Level 4 (top predator) • Migratory (resident until about age 7); sometimes males do not join Coastal migratory cohort • Samples consist of individuals of appropriate slot limit based on DNR regulations
MDE Lower threshold for 1 meal per month = 469 ppb (children = 269 ppb) EPA (MD) Fish Tissue Criteria for Mercury = 300 ppb
FDA Action Level = 1000 ppb (Above) EPA Tissue Criterion = 300 ppb (Below)
Striped Bass: Summary • Summary Statistics • Total # of analytical samples 129 • DNR ANSERC = 42 • MDE = 87 • Overall Average MDE & DNR samples combined = 137 ± 109 ppb • MDE Data Only (2002, 2003) = 106 ± 82 ppb • Concentration Range • Overall (15-607 ppb) • MDE Data Only –2002 & 2003 = (15-429) • Advisory Levels • Total # samples > FDA Action Level = 0 • Total # samples > EPA Tissue Criterion = 8/129 • Number of pre-2000 samples > EPA Tissue Criterion = 6 • Number of 2002-03 samples > EPA Tissue Criterion = 2
Risk Assessment Equation • [Fish Tissue] = RfD x BW x T MS X NM
Striped Bass Management Implications Based on Mercury • No advisory for mercury in rockfish, since current risk driver for striped bass advisory is PCBs • If PCBs were not present, the following advisory scenario would apply based on an average of 106 ppb: • General Population (8 oz meal): 8 meals/month • Women of Child Bearing Age (6 oz meal): 8 meals/month • Children ages 0-6 (3 oz meal): 4 meals/month • Also, since the average mercury concentration is below 300 ppb (mean = 106 ppb), the Chesapeake Bay is not required to be listed for mercury as an impairing substance under Section 303(d) CWA.
Data Summary: All Lakes • Largemouth Bass MeHg Concentration (By Length) • N = 204 Geometric Mean • 12” (305 mm) = 148 ppb • 12” – 14” (306- 350 mm) = 175 ppb • 14-16” (351- 400 mm) = 218 ppb • 16-18” (401- 450 mm) = 288 ppb • 18” (451 – 541 mm) = 608 ppb
Data Summary: Tier 1 Lakes • Largemouth Bass MeHg Concentration (By Length) • N = 171 Geometric Mean • 12” (305 mm) = 75 ppb • 12” – 14” (306- 350 mm) = 147 ppb • 14-16” (351- 400 mm) = 187 ppb • 16-18” (401- 450 mm) = 261 ppb • 18” (451 – 506 mm) = 421 ppb NOTE: Relationship does not persist for high Hg lakes
Data Summary: Tier 2 Lakes • Largemouth Bass MeHg Concentration (By Length) • N = 30 Geometric Mean • 12” (305 mm) = 360 ppb (n = 3) • 12” – 14” (306- 350 mm) = 433 ppb (n = 9) • 14-16” (351- 400 mm) = 719 ppb (n = 9) • 16-18” (401- 450 mm) = 564 ppb (n = 6) • 18” (451 – 541 mm) = 1191 ppb (n = 4)